


BD Horizon™ BV605 Mouse Anti-Rat CD3


 下载产品说明书 下载SDS
 用小程序,查商品更便捷


 收藏
收藏
 对比
对比 咨询
咨询
参考图片
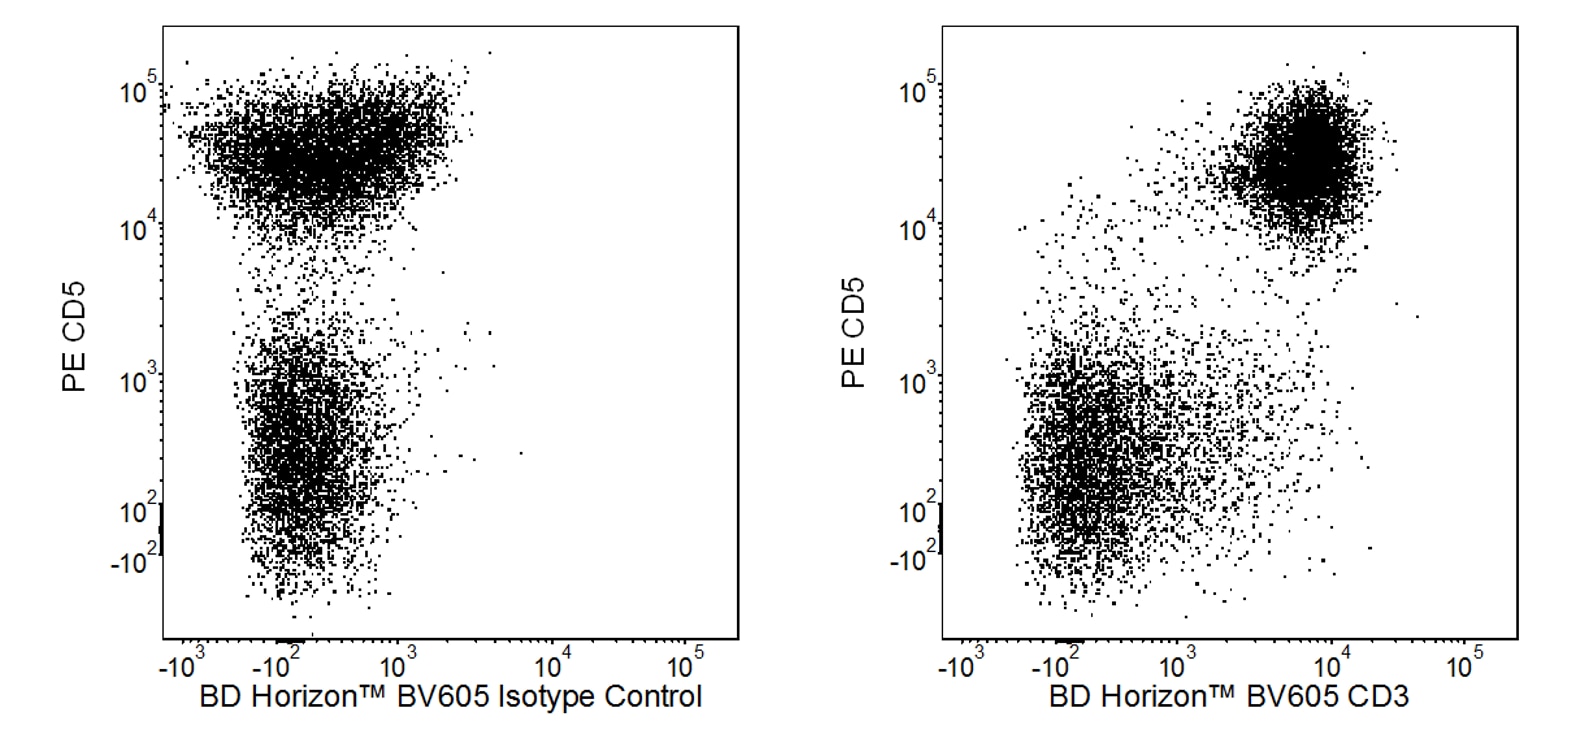
Two-color flow cytometric analysis of CD3 expression on rat splenocytes. Rat splenic leucocytes were stained with PE Mouse Anti-Rat CD5 antibody (Cat. No. 554851) and either BD Horizon™ BV605 Mouse IgM, κ Isotype Control (Cat. No. 56351 7; Left Panel) or BD Horizon™ BV605 Mouse Anti-Rat CD3 antibody (Cat. No. 563949; Right Panel). The two-color flow cytometric dot plot shows the correlated expression patterns of CD3 (or Ig Isotype control staining) versus CD5 for gated events with the forward and side light-scatter characteristics of viable splenic leucocytes.
Two-color flow cytometric analysis of CD3 expression on rat splenocytes. Rat splenic leucocytes were stained with PE Mouse Anti-Rat CD5 antibody (Cat. No. 554851) and either BD Horizon™ BV605 Mouse IgM, κ Isotype Control (Cat. No. 563517; Left Panel) or BD Horizon™ BV605 Mouse Anti-Rat CD3 antibody (Cat. No. 563949; Right Panel). The two-color flow cytometric dot plot shows the correlated expression patterns of CD3 (or Ig Isotype control staining) versus CD5 for gated events with the forward and side light-scatter characteristics of viable splenic leucocytes.

 危险品化学品经营许可证(不带存储) 许可证编号:沪(杨)应急管危经许[2022]202944(QY)
  营业执照(三证合一)