


 下载产品说明书
 用小程序,查商品更便捷


 收藏
收藏
 对比
对比 咨询
咨询
参考图片
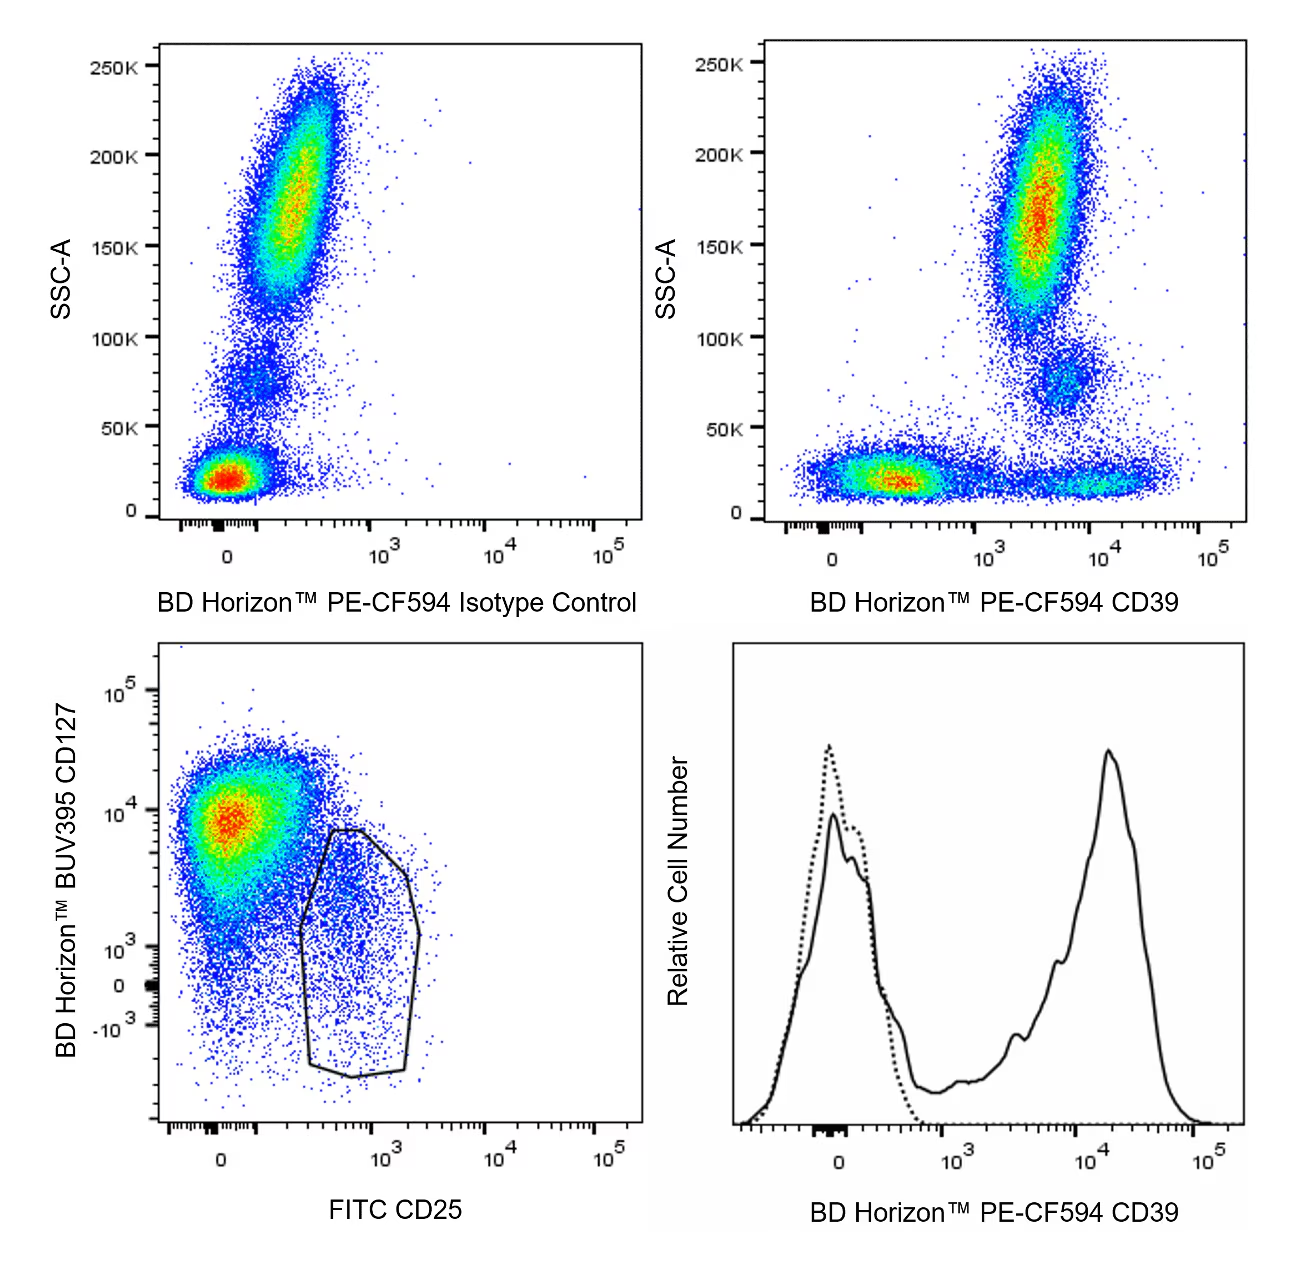
Flow cytometric analysis of CD39 expression on human peripheral blood leucocyte populations. Upper Plots: Whole blood was stained with either BD Horizon™ PE-CF594 Mouse IgG1, κ Isotype Control (Cat No. 562292, Left Plot) or BD Horizon™ PE-CF594 Mouse Anti-Human CD39 antibody (Cat No. 567668/ 567669, Right Plot). The erythrocytes were lysed with BD FACS™ Lysing Solution (Cat. No. 349202). A bivariate pseudocolor density plot showing the correlated expression of CD39 (or Ig Isotype control staining) versus side light-scatter signals (SSC-A) was derived from gated events with the forward and side light-scatter characteristics of viable leucocyte populations. Lower Plots: Human peripheral blood mononuclear cells (PBMC) were preincubated with BD Pharmingen™ Human BD Fc Block™ (Cat. No. 564219/564220) and then stained with BD Horizon™ BUV395 Mouse Anti-Human CD4 (Cat. No. 564724), FITC Mouse Anti-Human CD25 (Cat. No. 555431), BD Horizon™ BUV737 Mouse Anti-Human CD127 (Cat No. 564300) antibodies, and either BD Horizon™ PE-CF594 Mouse IgG1, κ Isotype Control (dashed line histogram) or BD Horizon™ PE-CF594 Mouse Anti-Human CD39 (solid line histogram). DAPI Solution (Cat. No. 564907) was added to cells right before analysis. A bivariate pseudocolor density plot showing the coexpressed levels of CD25 versus CD127 by viable (DAPI-negative) light scatter-gated CD4+ T cells [Left Plot] was further gated to reveal CD39 expression or Ig Isotype control staining [Right Plot] on CD4+CD25+CD127low T cells (ie, cells with a Regulatory T cell immunophenotype) as shown. Flow cytometric analysis was performed using a LSRFortessa™ X-20 Flow Cytometer System and FlowJo™ software.

 危险品化学品经营许可证(不带存储) 许可证编号:沪(杨)应急管危经许[2022]202944(QY)
 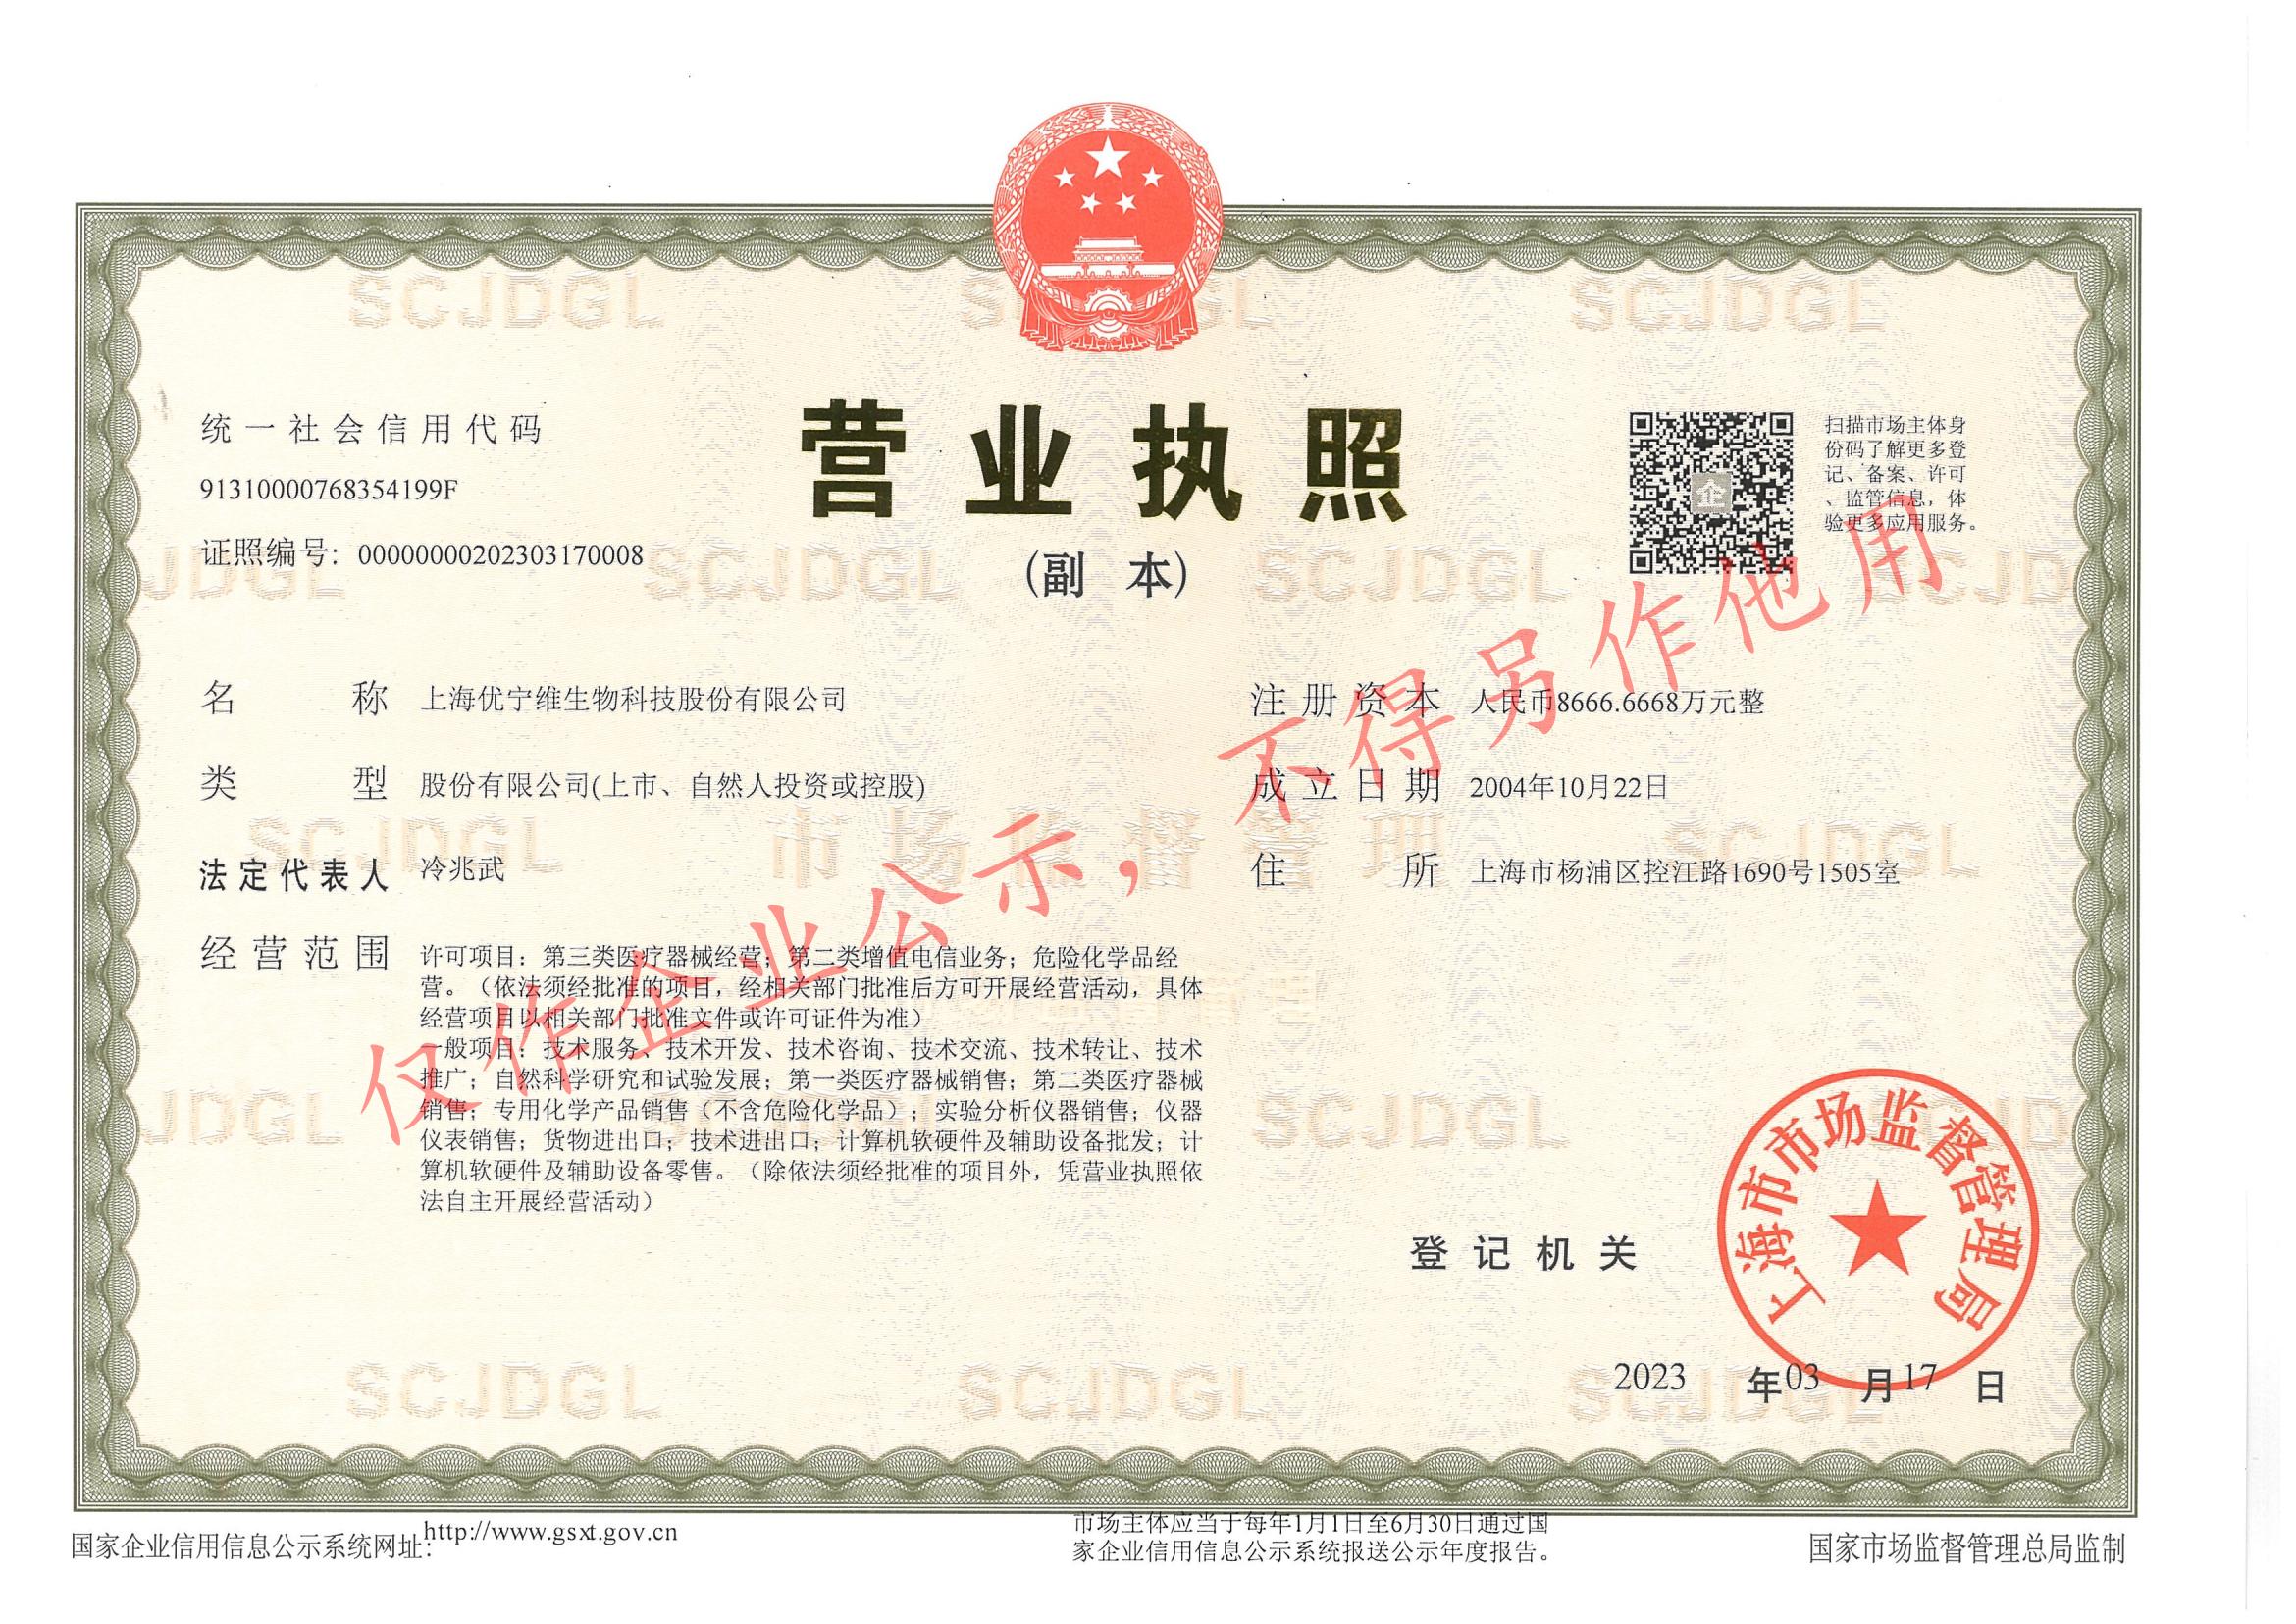 营业执照(三证合一)