


 下载产品说明书
 用小程序,查商品更便捷


 收藏
收藏
 对比
对比 咨询
咨询
参考图片
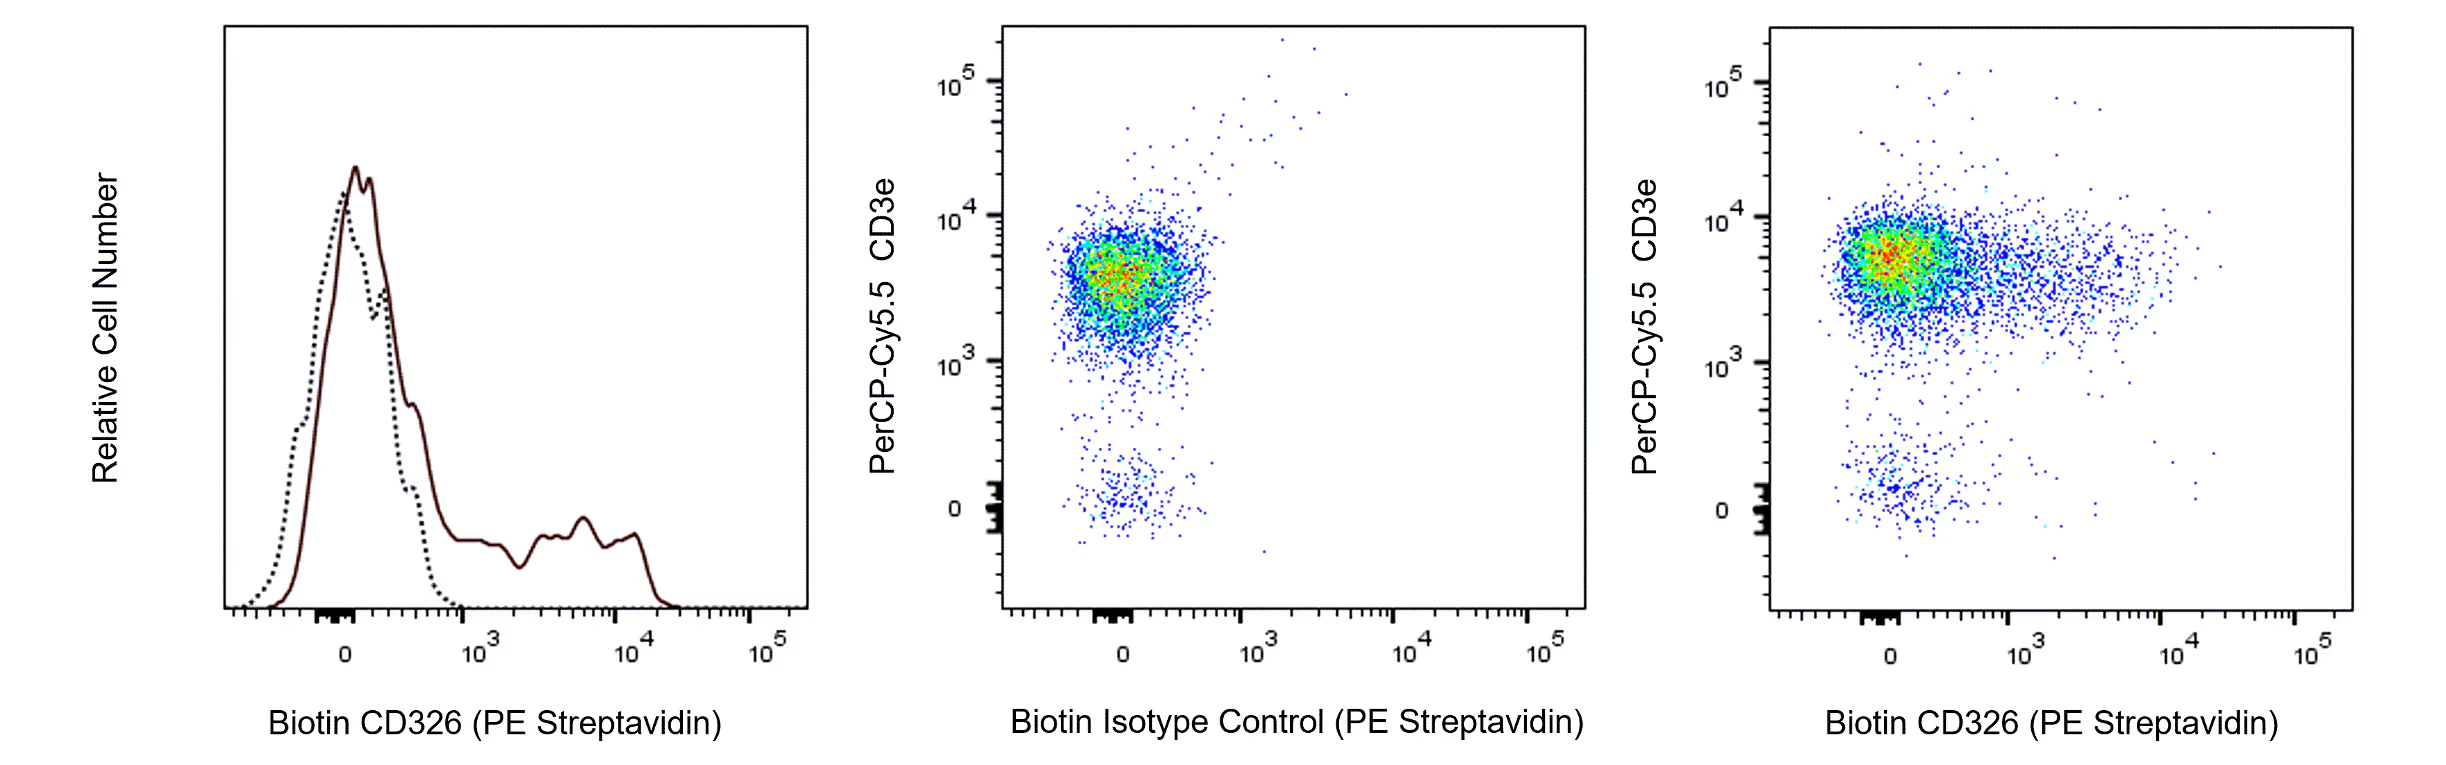
Multiparameter flow cytometric analysis of CD326 expression on mouse thymocytes and splenic T lymphocytes. BALB/c mouse thymocytes and splenic leucocytes were preincubated with Purified Rat Anti-Mouse CD16/CD32 antibody (Mouse BD Fc Block™) (Cat. No. 553141/553142) and stained with Biotin Rat IgG2a, κ Isotype Control (Cat. No. 553928) or Biotin Rat Anti-Mouse CD326 antibody (Cat. No. 567813) at 0.25 μg/test. Left Plot: Thymocytes were further stained with APC Rat Anti-Mouse CD4 (553051/561091) and BD Horizon™ BV510 Rat Anti-Mouse CD8a (563068) antibodies and counterstained with PE Streptavidin (Cat. No. 554061). The CD326 (solid line histogram) and Ig Isotype Control (dashed line histogram) fluorescence histograms were derived from CD4- and CD8-negative gated events with the forward and side light-scatter characteristics of viable thymocytes. Middle and Right Plots: The splenic leucocytes were further stained with PerCP-Cy5.5 Hamster Anti-Mouse CD3e (Cat. No. 551163) and APC Rat Anti-Mouse CD25 (Cat. No. 557192) antibodies. The cells were counterstained with PE Streptavidin (Cat. No. 554061). The bivariate pseudocolor density plot showing the correlated expression of Ig Isotype control staining (Middle Plot) or CD326 (Right Plot) versus CD3e were derived from CD25+ gated events with the forward and side light-scatter characteristics of viable splenic leucocytes. A small population of CD3+CD25+CD326+ cells were detected (Right Plot), whereas the CD25- T cells do not express detectable levels of CD326 (data not shown). Flow cytometry and data analysis were performed using a BD LSRFortessa™ X-20 Cell Analyzer System and FlowJo™ software. Data shown on this Technical Data Sheet are not lot specific.

 危险品化学品经营许可证(不带存储) 许可证编号:沪(杨)应急管危经许[2022]202944(QY)
  营业执照(三证合一)