


 下载产品说明书 下载SDS
 用小程序,查商品更便捷


 收藏
收藏
 对比
对比 咨询
咨询Simple Western(1 µg/mL)
Immunoprecipitation(1-3 µg/500 µg cell lysate)
Simple Western(1 µg/mL)
Immunoprecipitation(1-3 µg/500 µg cell lysate)

Arg575-Asn826
Accession # Q16665.1
Scientific Data
 View Larger
Detection of Human, Mouse, and Rat HIF-1 alpha/HIF1A by Western Blot. Western blot shows lysates of MCF-7 human breast cancer cell line, Balb-3T3 mouse embryonic fibroblast cell line, and PC-12 rat adrenal pheochromocytoma cell line untreated (-) or treated (+) with 150 µM CoCl2for 8 hours. PVDF membrane was probed with 1 µg/mL of Mouse Anti-Human/Mouse/Rat HIF-1 alpha/HIF1A Monoclonal Antibody, followed by HRP-conjugated Anti-Mouse IgG Secondary Antibody (Catalog # HAF007). A specific band was detected for HIF-1 alpha/HIF1A at approximately 120 kDa (as indicated). This experiment was conducted under reducing conditions and using Immunoblot Buffer Group 1.
.") View Larger
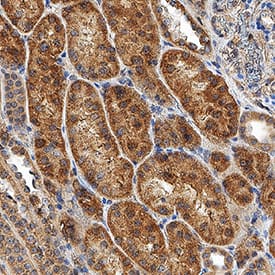
View LargerHIF-1 alpha/HIF1A in Human Kidney. HIF-1 alpha/HIF1A was detected in immersion fixed paraffin-embedded sections of human kidney using Mouse Anti-Human/Mouse/Rat HIF-1 alpha/HIF1A Monoclonal Antibody (Catalog # MAB1536) at 5 µg/mL for 1 hour at room temperature followed by incubation with the Anti-Mouse IgG VisUCyte™ HRP Polymer Antibody (Catalog # VC001). Before incubation with the primary antibody, tissue was subjected to heat-induced epitope retrieval using Antigen Retrieval Reagent-Basic (Catalog # CTS013). Tissue was stained using DAB (brown) and counterstained with hematoxylin (blue). Specific staining was localized to cytoplasm and nuclei. View our protocol for IHC Staining with VisUCyte HRP Polymer Detection Reagents.
 View Larger
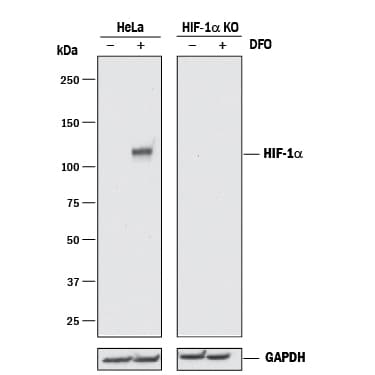
Western Blot Shows Human HIF-1 alpha/HIF1A alpha/HIF1A Specificity by Using Knockout Cell Line. Western blot shows lysates of HeLa human cervical epithelial carcinoma parental cell line and HIF-1 alpha/HIF1A knockout HeLa cell line (KO) untreated (-) or treated (+) with 1 mM DFO overnight. PVDF membrane was probed with 1 µg/mL of Mouse Anti-Human/Mouse/Rat HIF-1 alpha/HIF1A Monoclonal Antibody (Catalog # MAB1536) followed by HRP-conjugated Anti-Mouse IgG Secondary Antibody (Catalog # HAF018). A specific band was detected for HIF-1 alpha/HIF1A at approximately 110 kDa (as indicated) in the parental HeLa cell line, but is not detectable in knockout HeLa cell line. GAPDH (Catalog # MAB5718) is shown as a loading control. This experiment was conducted under reducing conditions and using Immunoblot Buffer Group 1.
 View Larger
Detection of Human HIF-1 alpha/HIF1A by Simple WesternTM. Simple Western lane view shows lysates of A549 human lung carcinoma cell line untreated (-) or treated (+) with Hypoxia (1% O2), loaded at 0.2 mg/mL. A specific band was detected for HIF-1 alpha/HIF1A at approximately 116 kDa (as indicated) using 10 µg/mL of Mouse Anti-Human/Mouse/Rat HIF-1 alpha/HIF1A Monoclonal Antibody (Catalog # MAB1536). This experiment was conducted under reducing conditions and using the 12-230 kDa separation system.
 View Larger
HIF-1 alpha/HIF1A Specificity is Shown by Immunocytochemistry in Knockout Cell Line. HIF-1 alpha/HIF1A was detected in immersion fixed HeLa human cervical epithelial carcinoma cell line treated with DFO but is not detected in HIF-1 alpha/HIF1A knockout (KO) HeLa Human Cell Line cell line using Mouse Anti-Human/Mouse/Rat HIF-1 alpha/HIF1A alpha/HIF1A Monoclonal Antibody (Catalog # MAB1536) at 8 µg/mL for 3 hours at room temperature. Cells were stained using the NorthernLights™ 557-conjugated Anti-Mouse IgG Secondary Antibody (red; Catalog # NL007) and counterstained with DAPI (blue). Specific staining was localized to nuclei. View our protocol for Fluorescent ICC Staining of Cells on Coverslips.
 View Larger
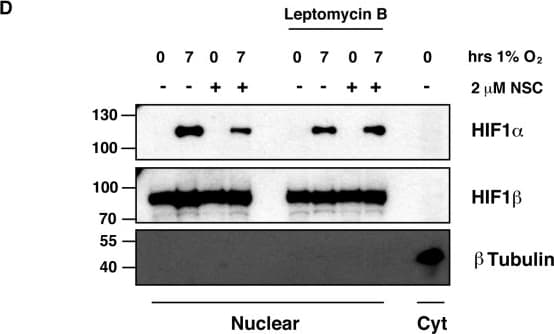
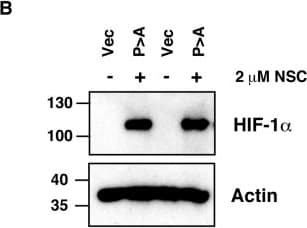
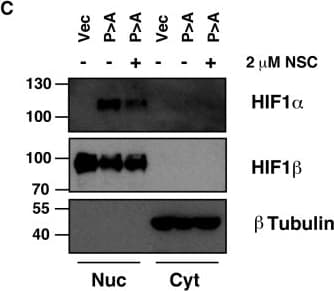
Detection of Human HIF-1 alpha by Western Blot Ubc13 activity is necessary for HIF1 alpha nuclear retention. (A) ChIP assays using Control IgG and HIF1 alpha antibodies were performed on cell extracts from U2OS cells pre-treated with 2μM NSC697923 for 30 min before being exposed to 1% O2 for 3 h. Immunoprecipitated DNA was analysed by qPCR using the indicated primer pairs and normalised to input genomic DNA. (B and C) U2OS cells were transfected with HA-HIF1 alpha (P402A, P564A) or empty vector and treated with 2 μM NSC697923 for 3 h. Whole cell lysates (B) or nuclear and cytoplasmic extracts (C) were prepared. Extracts were analysed by immunoblotting using the indicated antibodies. (D) Cytoplasmic and nuclear extracts were prepared from U2OS cells treated with 2 μM NSC697923 and 5 ng/ml Leptomycin B as indicated before being exposed to 1% O2 for 3 h. P-values are significant according to the Student's t-test; *P < 0.05, **P < 0.01. Image collected and cropped by CiteAb from the following publication (https://academic.oup.com/nar/article/45/16/9336/3896344), licensed under a CC-BY license. Not internally tested by R&D Systems.
 View Larger
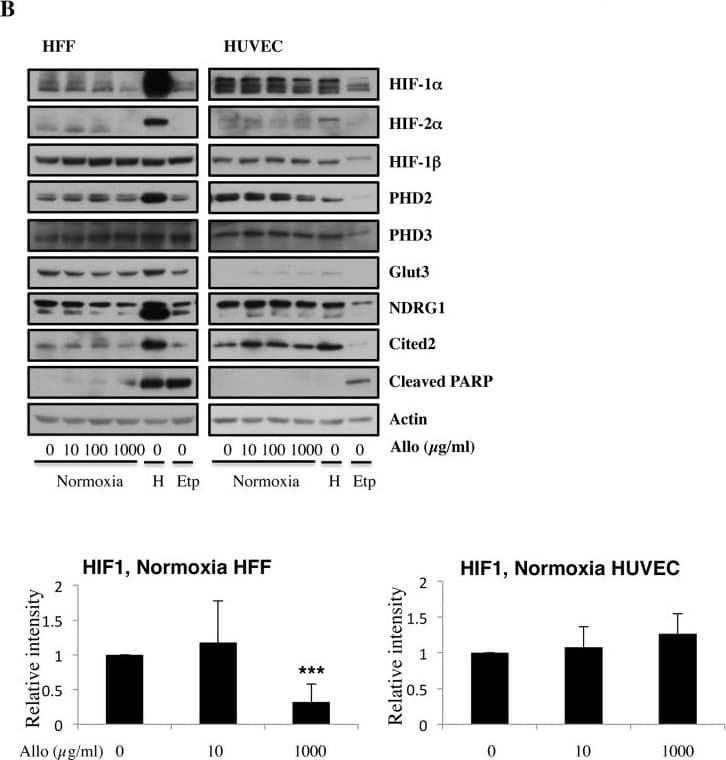
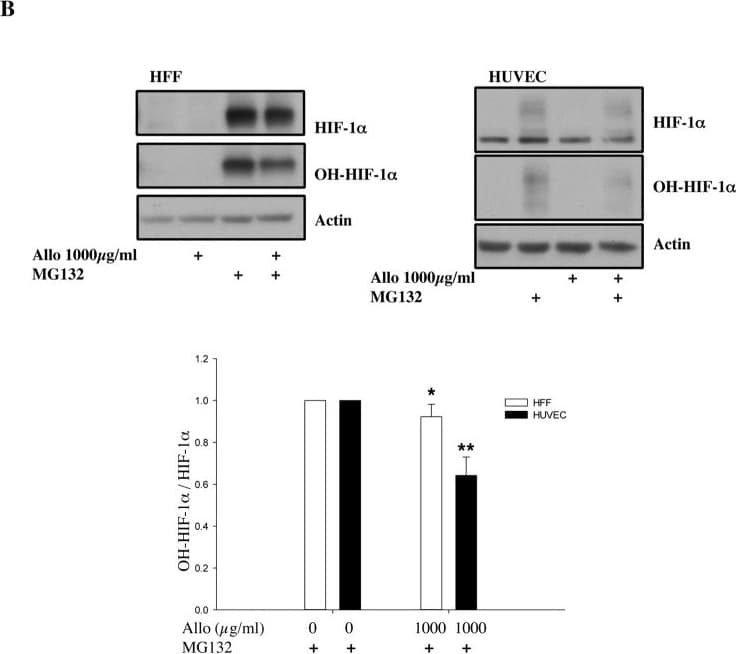
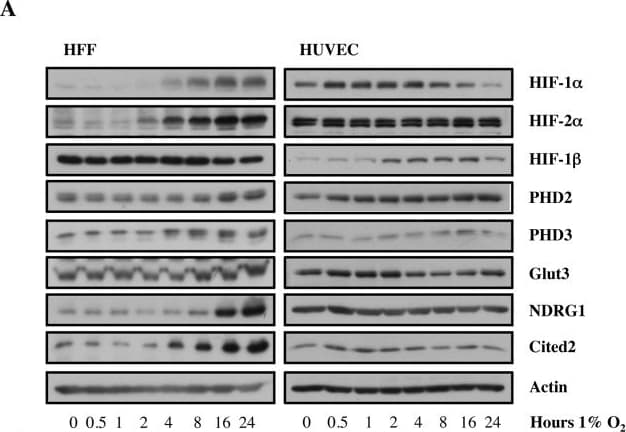
Detection of Human HIF-1 alpha by Western Blot Increasing doses of Allopurinol reduce HIF-1 alpha levels in normoxic HFFs and HUVEC cells.A. Characterisation of HFF and HUVEC response to hypoxia. Cells were exposed to hypoxia (1% oxygen) for the indicated periods of time. At the end of incubation, protein levels were determined in whole cell extracts by immunoblot analysis using the depicted antibodies. B. Cells were treated with Allopurinol at 10, 100 and 1000 μg/ml for 17 hours. Then the cells were lysed for assessment of the indicated protein levels. Cells were treated with Etoposide (Etop) for 24 hours under normoxia. H-cells exposed to 1% O2 for 16 hours. HIF-1 alpha levels were quantified using ImageJ software and graph depicts mean and standard deviation of a minimum of three independent experiments. Anova t-test was performed and p values calculated as follows: *p<0.05; **p<0.01; ***p<0.001. Image collected and cropped by CiteAb from the following publication (https://dx.plos.org/10.1371/journal.pone.0123649), licensed under a CC-BY license. Not internally tested by R&D Systems.
 View Larger
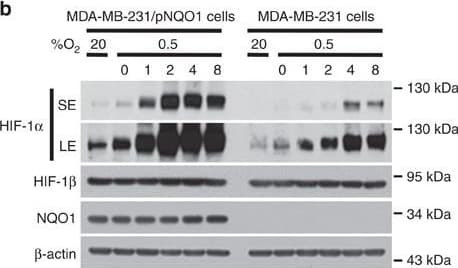
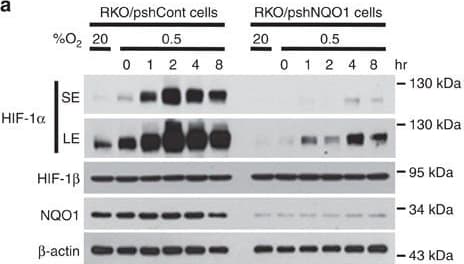
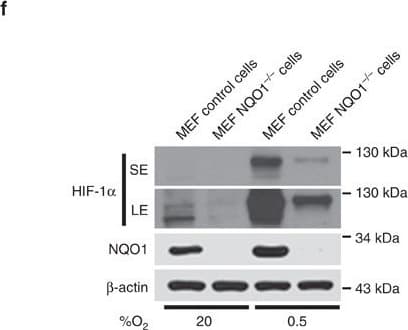
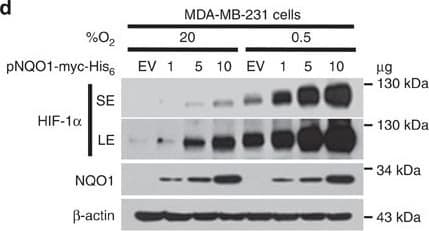
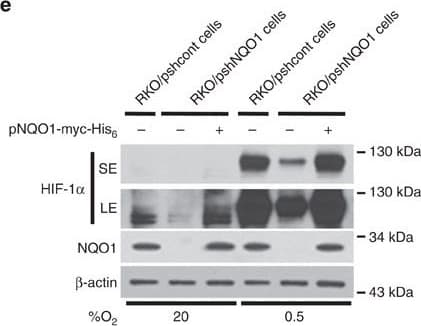
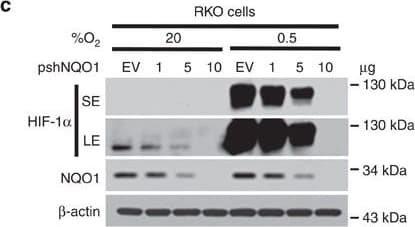
Detection of Human HIF-1 alpha by Western Blot NQO1 enhances HIF-1 alpha expression.(a,b) RKO cells (a) and MDA-MB-231 cells (b) were exposed to 0.5% O2 for 8 h and harvested at the indicated times. Whole-cell lysates were analysed by immunoblotting for HIF-1 alpha, HIF-1 beta, NQO1 and beta -actin. SE, short exposure; LE, long exposure. (c,d) Various concentrations of pshNQO1 and pNQO1-myc-His6 (0–10 μg) were transiently transfected into RKO (c) and MDA-MB-231 (d) cells, respectively. After 48 h, the cells were exposed to 20 or 0.5% O2 for another 2 h, and then harvested. Whole-cell lysates were analysed by immunoblotting for HIF-1 alpha, NQO1 and beta -actin. EV indicates pshCont (c) and pCDNA3.1-myc-His6 (d). SE, short exposure; LE, long exposure. (e) pNQO1-myc-His6 was transiently transfected into RKO/pshNQO1 cells. After 48 h, the cells were exposed to 0.5% O2 for 2 h, and then harvested. Whole-cell lysates were analysed by immunoblotting for HIF-1 alpha, NQO1 and beta -actin. SE, short exposure; LE, long exposure. (f) Mouse embryonic fibroblast wild type and NQO1−/− cells were exposed to 20 or 0.5% O2 for 2 h and then harvested. Whole-cell lysates were analysed by immunoblotting for HIF-1 alpha, NQO1 and beta -actin. SE, short exposure; LE, long exposure. Image collected and cropped by CiteAb from the following publication (https://pubmed.ncbi.nlm.nih.gov/27966538), licensed under a CC-BY license. Not internally tested by R&D Systems.
 View Larger
Detection of Human HIF-1 alpha by Immunohistochemistry Upregulation of NQO1 correlates with poor prognosis and expression of HIF-1 alpha in colorectal cancer.(a) An Oncomine analysis of the TCGA colorectal database indicated that NQO1 expressions are elevated in colorectal cancers (n=102) compared with normal colorectal tissues (n=19). ****P<0.0001 with unpaired t-test. (b,c) An Oncomine analysis of the Staub colorectal database (b) and the Reid database (c) indicate the elevated NQO1 mRNA expression correlates with the increased colorectal cancer grade (n=11 Grade 2, n=14 Grade 3; *P<0.02 with unpaired t-test) and that elevated NQO1 mRNA expression correlates with reduced patient survival at 5 years (**P<0.01 with unpaired t-test), respectively.The gene expression spectrum indicates that colours are z-score normalized to depict relative values within rows (left panel). They cannot be used to compare values between rows. For box plots, the centre line represents the median value, box limits are at the 25th and 75th percentiles, and whiskers represent minimum and maximum values (right panel). (d) NQO1 expression correlates with poor survival in colorectal cancer data set. Analysis of the colorectal cancer data set available through Oncomine indicates a significant correlation between the high-level expression of NQO1 and poor survival in the TCGA data set (n=21 NQO1 high, n=24 NQO1 low; P=0.0001 with log-rank analysis). HR, hazard ratio; CI, confidence interval. (e) Immunohistochemical detection of HIF-1 alpha in the high-level expression of NQO1 (n=11) compared with the low-level expression of NQO1 (n=9). Positive area score of HIF-1 alpha was determined on the most characteristic areas. The positive area score of HIF-1 alpha was evaluated by determining 10 high magnification power fields ( × 40). Statistical analysis of the average score of HIF-1 alpha positive area score is shown in the right panel (P=0.0218 with unpaired t-test). Scale bar, 100 μm. Image collected and cropped by CiteAb from the following publication (https://pubmed.ncbi.nlm.nih.gov/27966538), licensed under a CC-BY license. Not internally tested by R&D Systems.
 View Larger
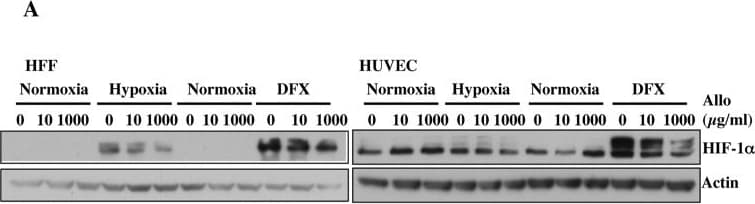
Detection of Human HIF-1 alpha by Western Blot Allopurinol reduces HIF-1 alpha levels independent of PHD function.A. Cells were pre-treated with Allopurinol at 10 and 1000 μg/ml for 60 minutes and then were incubated in 1% oxygen or treated with 200 μM DFX for 16 hours. Whole cell lysates were analysed by immunoblot using the indicated antibodies. B. Cells were pre-treated with Allopurinol at 1000 μg/ml for 60 minutes and then were incubated with 20μM MG132 for 3 hours. Whole cell lysates were analysed by immunoblot using the indicated antibodies. HIF-1 alpha levels were quantified using ImageJ software and graph depicts mean and standard deviation of a minimum of three independent experiments. Anova t-test was performed and p values calculated as follows: *p<0.05; **p<0.01; ***p<0.001. Image collected and cropped by CiteAb from the following publication (https://dx.plos.org/10.1371/journal.pone.0123649), licensed under a CC-BY license. Not internally tested by R&D Systems.
 View Larger
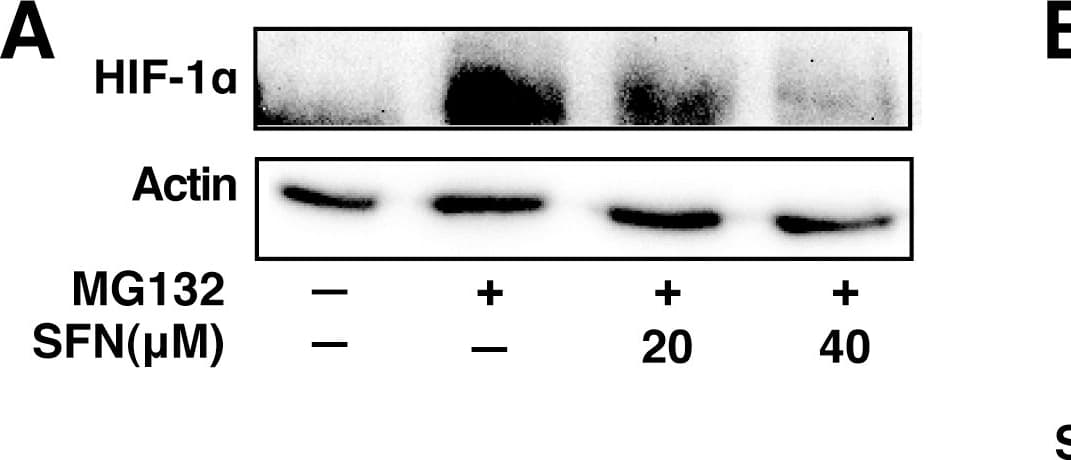
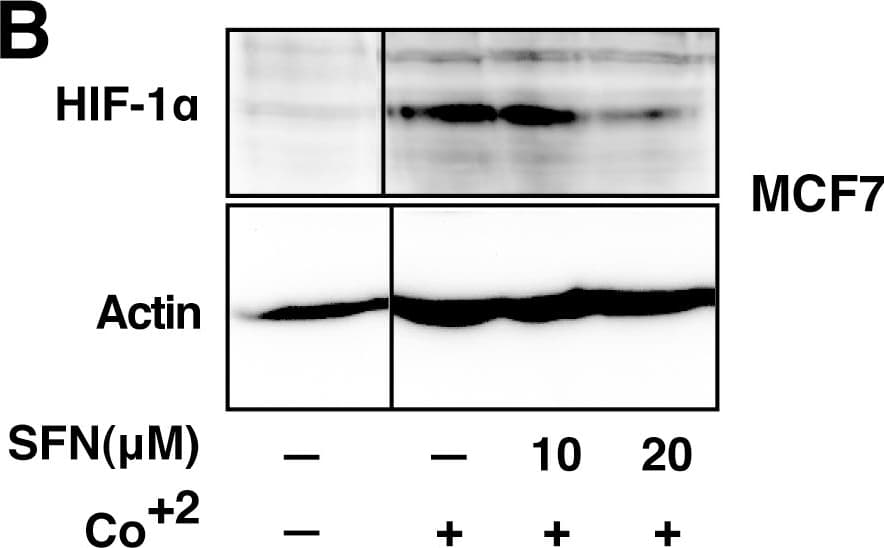
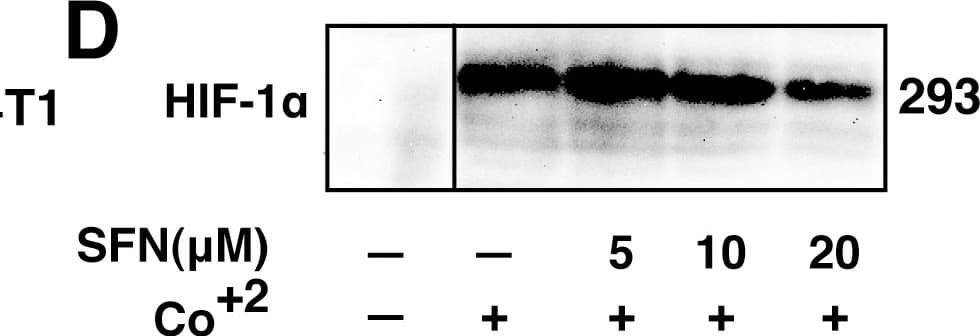
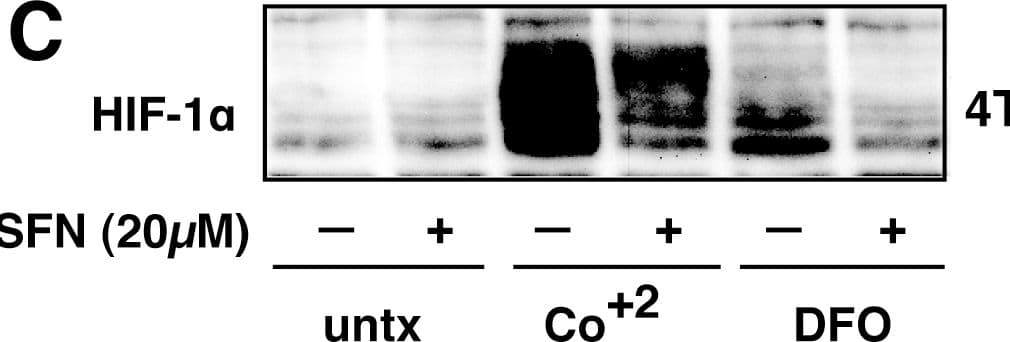
Detection of Human HIF-1 alpha by Western Blot SFN inhibits HIF-1 alpha protein accumulation.Cell lines were treated as described below, and total cell lysates subjected to immunoblot analysis. A, A549 cells were pretreated with or without SFN and MG132 (20 µM) for 1 hour. B, MCF7 cells were pretreated for 1 hour with indicated concentration of SFN, and then treated with 100µM cobalt chloride (Co+2) for an additional 5.5hours. C, 4T1 cells were pretreated for 20 min with 20 µM SFN, followed by treatment with 250µM cobalt chloride or 200µM desferroxamine as indicated for 4hours. D. 293 cells were pretreated for 20 min with indicated concentrations of SFN, followed by stimulation with 250 µM cobalt chloride for an additional 4 hours. Image collected and cropped by CiteAb from the following publication (https://pubmed.ncbi.nlm.nih.gov/23166763), licensed under a CC-BY license. Not internally tested by R&D Systems.
 View Larger
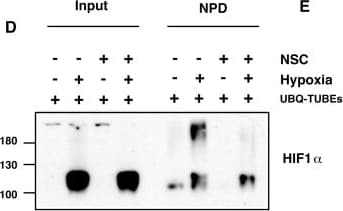
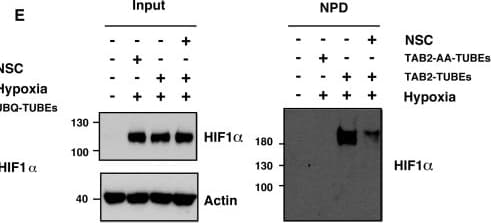
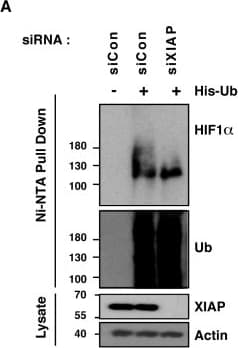
Detection of Human HIF-1 alpha by Western Blot XIAP ubiquitinates HIF1 alpha. (A) U2OS cells were transfected with siRNA oligonucleotides and His-tagged ubiquitin as indicated. Lysates were prepared and precipitated using nickel-conjugated beads followed by western blotting using the indicated antibodies. (B) HA-tagged plasmid encoding HIF1 alpha was coexpressed in HEK293 cells with His-tagged ubiquitin (Ub), FLAG-XIAP (X) or FLAG-VHL (V) as indicated. Lysates were prepared 48 h post-transfection and ubiquitinated material was recovered by incubation with nickel-conjugated beads and analysed by western blotting. (C) Biotinylated-HIF1 alpha was coexpressed in HEK293 cells with FLAG-tagged XIAP. HIF1 alpha was recovered from lysates by incubation with streptavidin-coated beads and analysed using antibodies directed against specific ubiquitin chains. (D) U2OS cells were pre-treated with 2μM NSC697923 for 30 min before being exposed to 1% O2 for 3 h. Cells were lysed in the presence of UBQ-TUBEs. Ubiquitin conjugates were purified using NiNTA agarose beads and analysed by immunoblotting using the indicated antibodies. (E) U2OS cells were pre-treated with 2 μM NSC697923 for 30 min before being exposed to 1% O2 for 3 h. Cells were lysed in the presence of TAB2-TUBEs or TAB2-AA-TUBEs as indicated. Proteins conjugated to Lys63-linked ubiquitin chains were purified using Ni-NTA agarose beads and analysed by immunoblot. Image collected and cropped by CiteAb from the following publication (https://academic.oup.com/nar/article/45/16/9336/3896344), licensed under a CC-BY license. Not internally tested by R&D Systems.
 View Larger
Detection of Human HIF-1 alpha by Western Blot Allopurinol reduces HIF-1 alpha levels independent of PHD function.A. Cells were pre-treated with Allopurinol at 10 and 1000 μg/ml for 60 minutes and then were incubated in 1% oxygen or treated with 200 μM DFX for 16 hours. Whole cell lysates were analysed by immunoblot using the indicated antibodies. B. Cells were pre-treated with Allopurinol at 1000 μg/ml for 60 minutes and then were incubated with 20μM MG132 for 3 hours. Whole cell lysates were analysed by immunoblot using the indicated antibodies. HIF-1 alpha levels were quantified using ImageJ software and graph depicts mean and standard deviation of a minimum of three independent experiments. Anova t-test was performed and p values calculated as follows: *p<0.05; **p<0.01; ***p<0.001. Image collected and cropped by CiteAb from the following publication (https://dx.plos.org/10.1371/journal.pone.0123649), licensed under a CC-BY license. Not internally tested by R&D Systems.
 View Larger
Detection of Human HIF-1 alpha by Western Blot XIAP ubiquitinates HIF1 alpha. (A) U2OS cells were transfected with siRNA oligonucleotides and His-tagged ubiquitin as indicated. Lysates were prepared and precipitated using nickel-conjugated beads followed by western blotting using the indicated antibodies. (B) HA-tagged plasmid encoding HIF1 alpha was coexpressed in HEK293 cells with His-tagged ubiquitin (Ub), FLAG-XIAP (X) or FLAG-VHL (V) as indicated. Lysates were prepared 48 h post-transfection and ubiquitinated material was recovered by incubation with nickel-conjugated beads and analysed by western blotting. (C) Biotinylated-HIF1 alpha was coexpressed in HEK293 cells with FLAG-tagged XIAP. HIF1 alpha was recovered from lysates by incubation with streptavidin-coated beads and analysed using antibodies directed against specific ubiquitin chains. (D) U2OS cells were pre-treated with 2μM NSC697923 for 30 min before being exposed to 1% O2 for 3 h. Cells were lysed in the presence of UBQ-TUBEs. Ubiquitin conjugates were purified using NiNTA agarose beads and analysed by immunoblotting using the indicated antibodies. (E) U2OS cells were pre-treated with 2 μM NSC697923 for 30 min before being exposed to 1% O2 for 3 h. Cells were lysed in the presence of TAB2-TUBEs or TAB2-AA-TUBEs as indicated. Proteins conjugated to Lys63-linked ubiquitin chains were purified using Ni-NTA agarose beads and analysed by immunoblot. Image collected and cropped by CiteAb from the following publication (https://academic.oup.com/nar/article/45/16/9336/3896344), licensed under a CC-BY license. Not internally tested by R&D Systems.
 View Larger
Detection of Human HIF-1 alpha by Western Blot SFN inhibits HIF-1 alpha protein accumulation.Cell lines were treated as described below, and total cell lysates subjected to immunoblot analysis. A, A549 cells were pretreated with or without SFN and MG132 (20 µM) for 1 hour. B, MCF7 cells were pretreated for 1 hour with indicated concentration of SFN, and then treated with 100µM cobalt chloride (Co+2) for an additional 5.5hours. C, 4T1 cells were pretreated for 20 min with 20 µM SFN, followed by treatment with 250µM cobalt chloride or 200µM desferroxamine as indicated for 4hours. D. 293 cells were pretreated for 20 min with indicated concentrations of SFN, followed by stimulation with 250 µM cobalt chloride for an additional 4 hours. Image collected and cropped by CiteAb from the following publication (https://pubmed.ncbi.nlm.nih.gov/23166763), licensed under a CC-BY license. Not internally tested by R&D Systems.
 View Larger
Detection of Human HIF-1 alpha by Western Blot NQO1 enhances HIF-1 alpha expression.(a,b) RKO cells (a) and MDA-MB-231 cells (b) were exposed to 0.5% O2 for 8 h and harvested at the indicated times. Whole-cell lysates were analysed by immunoblotting for HIF-1 alpha, HIF-1 beta, NQO1 and beta -actin. SE, short exposure; LE, long exposure. (c,d) Various concentrations of pshNQO1 and pNQO1-myc-His6 (0–10 μg) were transiently transfected into RKO (c) and MDA-MB-231 (d) cells, respectively. After 48 h, the cells were exposed to 20 or 0.5% O2 for another 2 h, and then harvested. Whole-cell lysates were analysed by immunoblotting for HIF-1 alpha, NQO1 and beta -actin. EV indicates pshCont (c) and pCDNA3.1-myc-His6 (d). SE, short exposure; LE, long exposure. (e) pNQO1-myc-His6 was transiently transfected into RKO/pshNQO1 cells. After 48 h, the cells were exposed to 0.5% O2 for 2 h, and then harvested. Whole-cell lysates were analysed by immunoblotting for HIF-1 alpha, NQO1 and beta -actin. SE, short exposure; LE, long exposure. (f) Mouse embryonic fibroblast wild type and NQO1−/− cells were exposed to 20 or 0.5% O2 for 2 h and then harvested. Whole-cell lysates were analysed by immunoblotting for HIF-1 alpha, NQO1 and beta -actin. SE, short exposure; LE, long exposure. Image collected and cropped by CiteAb from the following publication (https://pubmed.ncbi.nlm.nih.gov/27966538), licensed under a CC-BY license. Not internally tested by R&D Systems.
 View Larger
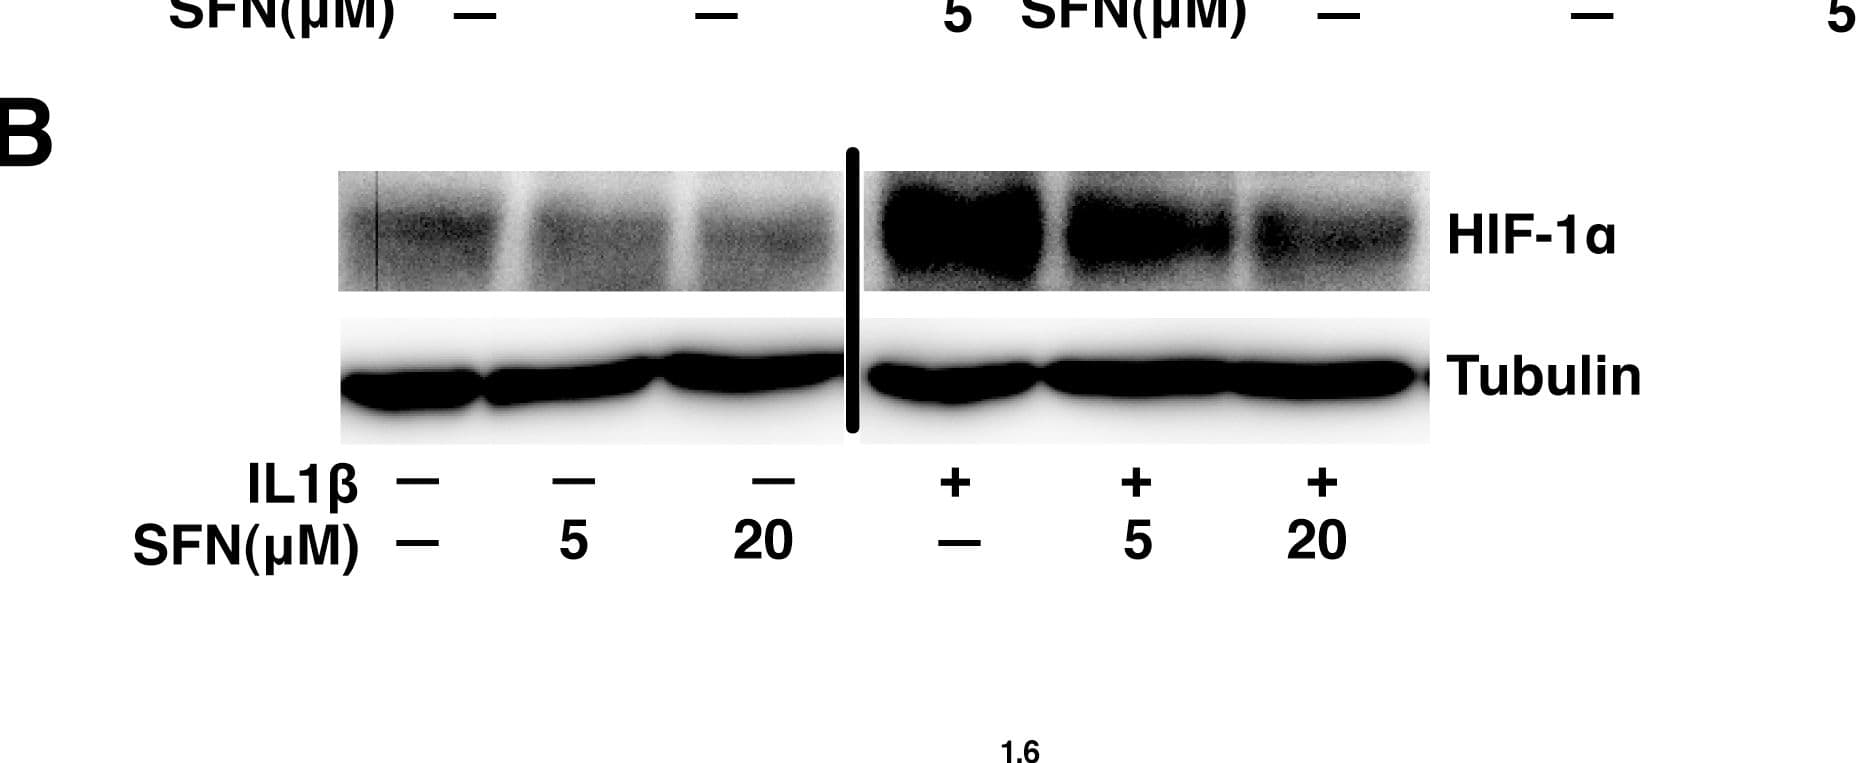
Detection of Human HIF-1 alpha by Western Blot SFN suppresses the HIF-1–mPGES –PGE2 axis by control of HIF-1 alpha protein expression without altering mRNA levels.A, A549 cells were pretreated with or without SFN for 30 minutes. IL1 beta (1 ng/ml) was then added and cells were cultured for another 4 hours. Total RNA was analyzed by quantitative RT-PCR. The results are expressed as fold change relative to untreated cells (mean ± SEM; n = 3). B&C, A549 cells were pretreated with or without SFN for 30 minutes. IL1 beta (1 ng/ml) was then added or not and cells were cultured for another 4 hours. Total cell lysates were subjected to immunoblot analysis (panel B) and total RNA was analyzed by quantitative RT-PCR (panel C). Image collected and cropped by CiteAb from the following publication (https://pubmed.ncbi.nlm.nih.gov/23166763), licensed under a CC-BY license. Not internally tested by R&D Systems.
 View Larger
Detection of Human HIF-1 alpha by Western Blot Ubc13 activity is necessary for HIF1 alpha nuclear retention. (A) ChIP assays using Control IgG and HIF1 alpha antibodies were performed on cell extracts from U2OS cells pre-treated with 2μM NSC697923 for 30 min before being exposed to 1% O2 for 3 h. Immunoprecipitated DNA was analysed by qPCR using the indicated primer pairs and normalised to input genomic DNA. (B and C) U2OS cells were transfected with HA-HIF1 alpha (P402A, P564A) or empty vector and treated with 2 μM NSC697923 for 3 h. Whole cell lysates (B) or nuclear and cytoplasmic extracts (C) were prepared. Extracts were analysed by immunoblotting using the indicated antibodies. (D) Cytoplasmic and nuclear extracts were prepared from U2OS cells treated with 2 μM NSC697923 and 5 ng/ml Leptomycin B as indicated before being exposed to 1% O2 for 3 h. P-values are significant according to the Student's t-test; *P < 0.05, **P < 0.01. Image collected and cropped by CiteAb from the following publication (https://academic.oup.com/nar/article/45/16/9336/3896344), licensed under a CC-BY license. Not internally tested by R&D Systems.
 View Larger
Detection of Human HIF-1 alpha by Western Blot SFN inhibits HIF-1 alpha protein accumulation.Cell lines were treated as described below, and total cell lysates subjected to immunoblot analysis. A, A549 cells were pretreated with or without SFN and MG132 (20 µM) for 1 hour. B, MCF7 cells were pretreated for 1 hour with indicated concentration of SFN, and then treated with 100µM cobalt chloride (Co+2) for an additional 5.5hours. C, 4T1 cells were pretreated for 20 min with 20 µM SFN, followed by treatment with 250µM cobalt chloride or 200µM desferroxamine as indicated for 4hours. D. 293 cells were pretreated for 20 min with indicated concentrations of SFN, followed by stimulation with 250 µM cobalt chloride for an additional 4 hours. Image collected and cropped by CiteAb from the following publication (https://pubmed.ncbi.nlm.nih.gov/23166763), licensed under a CC-BY license. Not internally tested by R&D Systems.
 View Larger
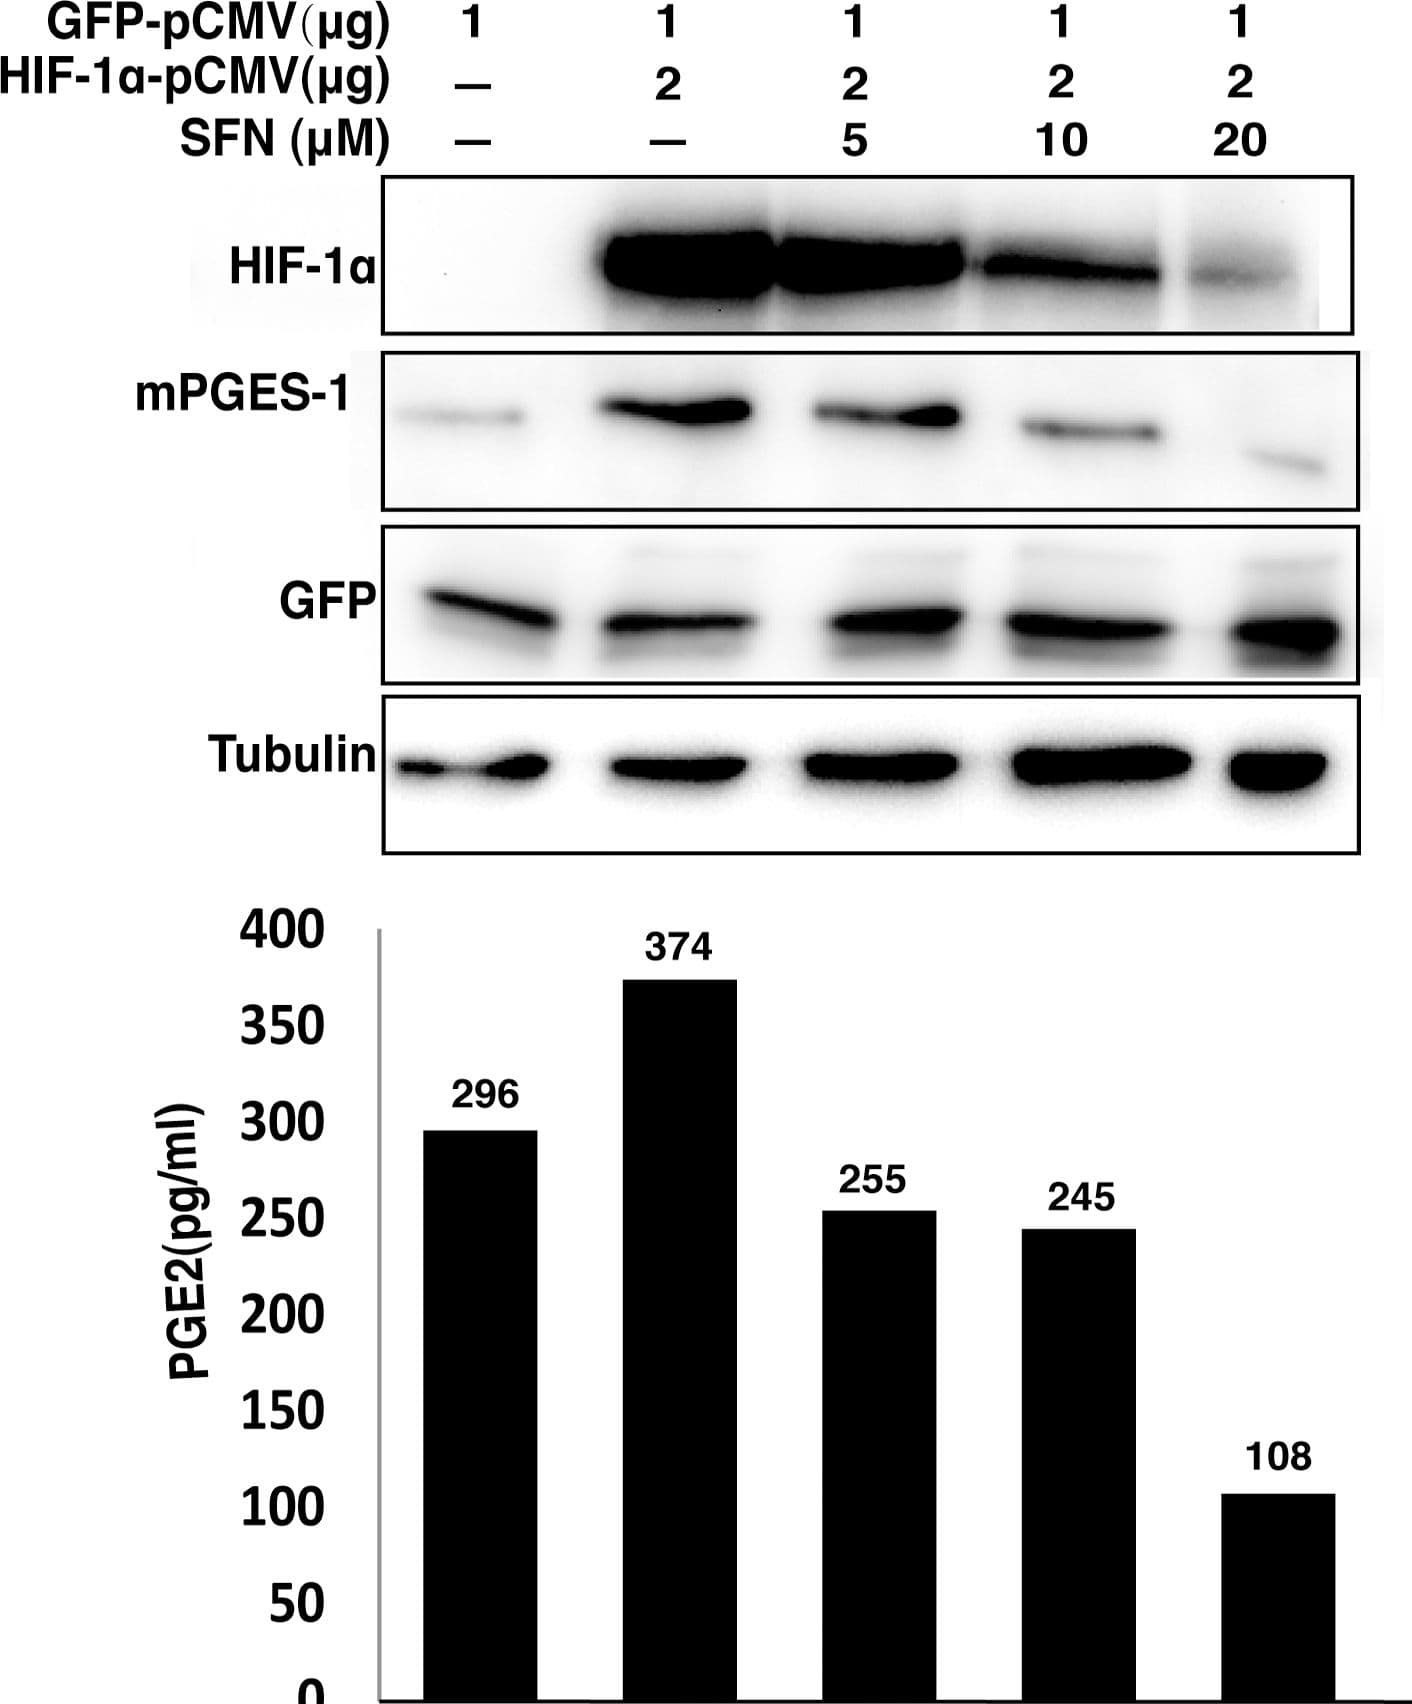
Detection of Mouse HIF-1 alpha by Western Blot SFN suppresses mPGES expression and PGE2 production driven by overexpression of HIF1 alpha.A549 cells were transfected with indicated amounts of HIF-1 alpha and GFP expression vectors. The total amount of transfected DNA (4 µg) was kept constant by addition of the empty vector. The cells were then left untreated or treated with increasing concentrations of SFN for 40 hours. The total cell extracts were prepared for immunoblot analysis to evaluate protein levels. The cell culture media were used for measuring PGE2 concentration by EIA assay. Image collected and cropped by CiteAb from the following publication (https://pubmed.ncbi.nlm.nih.gov/23166763), licensed under a CC-BY license. Not internally tested by R&D Systems.
 View Larger
Detection of Human HIF-1 alpha by Western Blot NQO1 enhances HIF-1 alpha expression.(a,b) RKO cells (a) and MDA-MB-231 cells (b) were exposed to 0.5% O2 for 8 h and harvested at the indicated times. Whole-cell lysates were analysed by immunoblotting for HIF-1 alpha, HIF-1 beta, NQO1 and beta -actin. SE, short exposure; LE, long exposure. (c,d) Various concentrations of pshNQO1 and pNQO1-myc-His6 (0–10 μg) were transiently transfected into RKO (c) and MDA-MB-231 (d) cells, respectively. After 48 h, the cells were exposed to 20 or 0.5% O2 for another 2 h, and then harvested. Whole-cell lysates were analysed by immunoblotting for HIF-1 alpha, NQO1 and beta -actin. EV indicates pshCont (c) and pCDNA3.1-myc-His6 (d). SE, short exposure; LE, long exposure. (e) pNQO1-myc-His6 was transiently transfected into RKO/pshNQO1 cells. After 48 h, the cells were exposed to 0.5% O2 for 2 h, and then harvested. Whole-cell lysates were analysed by immunoblotting for HIF-1 alpha, NQO1 and beta -actin. SE, short exposure; LE, long exposure. (f) Mouse embryonic fibroblast wild type and NQO1−/− cells were exposed to 20 or 0.5% O2 for 2 h and then harvested. Whole-cell lysates were analysed by immunoblotting for HIF-1 alpha, NQO1 and beta -actin. SE, short exposure; LE, long exposure. Image collected and cropped by CiteAb from the following publication (https://pubmed.ncbi.nlm.nih.gov/27966538), licensed under a CC-BY license. Not internally tested by R&D Systems.
 View Larger
Detection of Mouse HIF-1 alpha by Western Blot SFN inhibits HIF-1 alpha protein accumulation.Cell lines were treated as described below, and total cell lysates subjected to immunoblot analysis. A, A549 cells were pretreated with or without SFN and MG132 (20 µM) for 1 hour. B, MCF7 cells were pretreated for 1 hour with indicated concentration of SFN, and then treated with 100µM cobalt chloride (Co+2) for an additional 5.5hours. C, 4T1 cells were pretreated for 20 min with 20 µM SFN, followed by treatment with 250µM cobalt chloride or 200µM desferroxamine as indicated for 4hours. D. 293 cells were pretreated for 20 min with indicated concentrations of SFN, followed by stimulation with 250 µM cobalt chloride for an additional 4 hours. Image collected and cropped by CiteAb from the following publication (https://pubmed.ncbi.nlm.nih.gov/23166763), licensed under a CC-BY license. Not internally tested by R&D Systems.
 View Larger
Detection of Human HIF-1 alpha by Western Blot NQO1 enhances HIF-1 alpha expression.(a,b) RKO cells (a) and MDA-MB-231 cells (b) were exposed to 0.5% O2 for 8 h and harvested at the indicated times. Whole-cell lysates were analysed by immunoblotting for HIF-1 alpha, HIF-1 beta, NQO1 and beta -actin. SE, short exposure; LE, long exposure. (c,d) Various concentrations of pshNQO1 and pNQO1-myc-His6 (0–10 μg) were transiently transfected into RKO (c) and MDA-MB-231 (d) cells, respectively. After 48 h, the cells were exposed to 20 or 0.5% O2 for another 2 h, and then harvested. Whole-cell lysates were analysed by immunoblotting for HIF-1 alpha, NQO1 and beta -actin. EV indicates pshCont (c) and pCDNA3.1-myc-His6 (d). SE, short exposure; LE, long exposure. (e) pNQO1-myc-His6 was transiently transfected into RKO/pshNQO1 cells. After 48 h, the cells were exposed to 0.5% O2 for 2 h, and then harvested. Whole-cell lysates were analysed by immunoblotting for HIF-1 alpha, NQO1 and beta -actin. SE, short exposure; LE, long exposure. (f) Mouse embryonic fibroblast wild type and NQO1−/− cells were exposed to 20 or 0.5% O2 for 2 h and then harvested. Whole-cell lysates were analysed by immunoblotting for HIF-1 alpha, NQO1 and beta -actin. SE, short exposure; LE, long exposure. Image collected and cropped by CiteAb from the following publication (https://pubmed.ncbi.nlm.nih.gov/27966538), licensed under a CC-BY license. Not internally tested by R&D Systems.
 View Larger
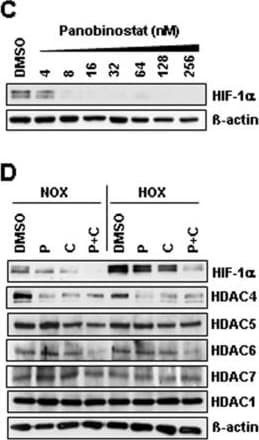
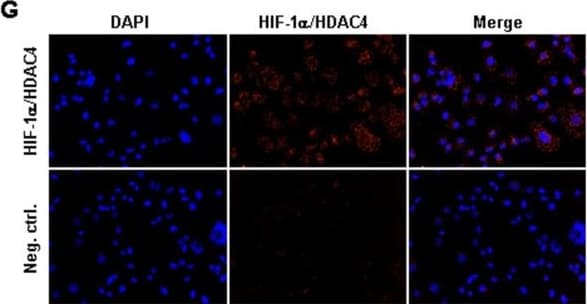
Detection of Human HIF-1 alpha by Immunocytochemistry/Immunofluorescence Identification of histone-acetylation and HIF-destabilization in H23 cells upon co-treatment with panobinostat and cisplatin. (A) H23 cells were treated with increasing panobinostat concentrations under normoxic conditions and the amount of acetylated histone proteins H3 and H4 was detected by immunoblotting. (B) H23 cells were treated with different combinations of cisplatin or/and panobinostat both under normoxic (NOX) or hypoxic (HOX) conditions. The amounts of Ac-H3 and Ac-H4 were analyzed 24 hours later by immunoblotting. (C) After 24 hours treatment with increasing panobinostat concentrations immunoblotting for HIF-1 alpha and HIF-2 alpha was performed. (D) H23 cells were treated with cisplatin, panobinostat or with combination of both under normoxic and hypoxic conditions. After 24 hours immunoblotting for HIF-1 alpha, class II HDACs (HDAC4, 5, 6 and 7) and HDAC1 (class I) was performed. After stripping beta -actin was used as a loading control. Ac-H3 and H4, acetylated histone proteins; DMSO, vehicle control; P, panobinostat (16 nM); C, cisplatin (16 μM); P + C (16 nM panobinostat + 16 μM cisplatin); NOX, normoxia; HOX, hypoxia. (E) H23 cells were transfected with 10 nM of HIF-1 alpha siRNA and after 24 hours knock-down effects were detected by qRT-PCR and by immunoblotting. (F) H23 cells transfected with HIF-1 alpha siRNA were treated with different cisplatin concentrations for 24 hours under hypoxic conditions and cell viability was measured using the AlamarBlue® assay. Viability of untreated cells was set to 100%. Data were compared to cells transfected with control, non-silencing RNA (CTRL). ns, not significant; * P < 0.05; ** P < 0.01; *** P < 0.001. (G) Protein-protein interaction between HIF-1 alpha and HDAC4 was determined by Duolink in situ proximity ligation assay and visualized by fluorescence microscopy. For negative control primary antibodies were omitted. Magnification: 200x. Image collected and cropped by CiteAb from the following publication (https://pubmed.ncbi.nlm.nih.gov/25608569), licensed under a CC-BY license. Not internally tested by R&D Systems.
 View Larger
Detection of Human HIF-1 alpha by Western Blot XIAP ubiquitinates HIF1 alpha. (A) U2OS cells were transfected with siRNA oligonucleotides and His-tagged ubiquitin as indicated. Lysates were prepared and precipitated using nickel-conjugated beads followed by western blotting using the indicated antibodies. (B) HA-tagged plasmid encoding HIF1 alpha was coexpressed in HEK293 cells with His-tagged ubiquitin (Ub), FLAG-XIAP (X) or FLAG-VHL (V) as indicated. Lysates were prepared 48 h post-transfection and ubiquitinated material was recovered by incubation with nickel-conjugated beads and analysed by western blotting. (C) Biotinylated-HIF1 alpha was coexpressed in HEK293 cells with FLAG-tagged XIAP. HIF1 alpha was recovered from lysates by incubation with streptavidin-coated beads and analysed using antibodies directed against specific ubiquitin chains. (D) U2OS cells were pre-treated with 2μM NSC697923 for 30 min before being exposed to 1% O2 for 3 h. Cells were lysed in the presence of UBQ-TUBEs. Ubiquitin conjugates were purified using NiNTA agarose beads and analysed by immunoblotting using the indicated antibodies. (E) U2OS cells were pre-treated with 2 μM NSC697923 for 30 min before being exposed to 1% O2 for 3 h. Cells were lysed in the presence of TAB2-TUBEs or TAB2-AA-TUBEs as indicated. Proteins conjugated to Lys63-linked ubiquitin chains were purified using Ni-NTA agarose beads and analysed by immunoblot. Image collected and cropped by CiteAb from the following publication (https://academic.oup.com/nar/article/45/16/9336/3896344), licensed under a CC-BY license. Not internally tested by R&D Systems.
 View Larger
Detection of Human HIF-1 alpha by Western Blot Identification of histone-acetylation and HIF-destabilization in H23 cells upon co-treatment with panobinostat and cisplatin. (A) H23 cells were treated with increasing panobinostat concentrations under normoxic conditions and the amount of acetylated histone proteins H3 and H4 was detected by immunoblotting. (B) H23 cells were treated with different combinations of cisplatin or/and panobinostat both under normoxic (NOX) or hypoxic (HOX) conditions. The amounts of Ac-H3 and Ac-H4 were analyzed 24 hours later by immunoblotting. (C) After 24 hours treatment with increasing panobinostat concentrations immunoblotting for HIF-1 alpha and HIF-2 alpha was performed. (D) H23 cells were treated with cisplatin, panobinostat or with combination of both under normoxic and hypoxic conditions. After 24 hours immunoblotting for HIF-1 alpha, class II HDACs (HDAC4, 5, 6 and 7) and HDAC1 (class I) was performed. After stripping beta -actin was used as a loading control. Ac-H3 and H4, acetylated histone proteins; DMSO, vehicle control; P, panobinostat (16 nM); C, cisplatin (16 μM); P + C (16 nM panobinostat + 16 μM cisplatin); NOX, normoxia; HOX, hypoxia. (E) H23 cells were transfected with 10 nM of HIF-1 alpha siRNA and after 24 hours knock-down effects were detected by qRT-PCR and by immunoblotting. (F) H23 cells transfected with HIF-1 alpha siRNA were treated with different cisplatin concentrations for 24 hours under hypoxic conditions and cell viability was measured using the AlamarBlue® assay. Viability of untreated cells was set to 100%. Data were compared to cells transfected with control, non-silencing RNA (CTRL). ns, not significant; * P < 0.05; ** P < 0.01; *** P < 0.001. (G) Protein-protein interaction between HIF-1 alpha and HDAC4 was determined by Duolink in situ proximity ligation assay and visualized by fluorescence microscopy. For negative control primary antibodies were omitted. Magnification: 200x. Image collected and cropped by CiteAb from the following publication (https://pubmed.ncbi.nlm.nih.gov/25608569), licensed under a CC-BY license. Not internally tested by R&D Systems.
 View Larger
Detection of Human HIF-1 alpha by Western Blot NQO1 enhances HIF-1 alpha expression.(a,b) RKO cells (a) and MDA-MB-231 cells (b) were exposed to 0.5% O2 for 8 h and harvested at the indicated times. Whole-cell lysates were analysed by immunoblotting for HIF-1 alpha, HIF-1 beta, NQO1 and beta -actin. SE, short exposure; LE, long exposure. (c,d) Various concentrations of pshNQO1 and pNQO1-myc-His6 (0–10 μg) were transiently transfected into RKO (c) and MDA-MB-231 (d) cells, respectively. After 48 h, the cells were exposed to 20 or 0.5% O2 for another 2 h, and then harvested. Whole-cell lysates were analysed by immunoblotting for HIF-1 alpha, NQO1 and beta -actin. EV indicates pshCont (c) and pCDNA3.1-myc-His6 (d). SE, short exposure; LE, long exposure. (e) pNQO1-myc-His6 was transiently transfected into RKO/pshNQO1 cells. After 48 h, the cells were exposed to 0.5% O2 for 2 h, and then harvested. Whole-cell lysates were analysed by immunoblotting for HIF-1 alpha, NQO1 and beta -actin. SE, short exposure; LE, long exposure. (f) Mouse embryonic fibroblast wild type and NQO1−/− cells were exposed to 20 or 0.5% O2 for 2 h and then harvested. Whole-cell lysates were analysed by immunoblotting for HIF-1 alpha, NQO1 and beta -actin. SE, short exposure; LE, long exposure. Image collected and cropped by CiteAb from the following publication (https://pubmed.ncbi.nlm.nih.gov/27966538), licensed under a CC-BY license. Not internally tested by R&D Systems.
 View Larger
Detection of Human HIF-1 alpha by Western Blot Ubc13 activity is necessary for HIF1 alpha nuclear retention. (A) ChIP assays using Control IgG and HIF1 alpha antibodies were performed on cell extracts from U2OS cells pre-treated with 2μM NSC697923 for 30 min before being exposed to 1% O2 for 3 h. Immunoprecipitated DNA was analysed by qPCR using the indicated primer pairs and normalised to input genomic DNA. (B and C) U2OS cells were transfected with HA-HIF1 alpha (P402A, P564A) or empty vector and treated with 2 μM NSC697923 for 3 h. Whole cell lysates (B) or nuclear and cytoplasmic extracts (C) were prepared. Extracts were analysed by immunoblotting using the indicated antibodies. (D) Cytoplasmic and nuclear extracts were prepared from U2OS cells treated with 2 μM NSC697923 and 5 ng/ml Leptomycin B as indicated before being exposed to 1% O2 for 3 h. P-values are significant according to the Student's t-test; *P < 0.05, **P < 0.01. Image collected and cropped by CiteAb from the following publication (https://academic.oup.com/nar/article/45/16/9336/3896344), licensed under a CC-BY license. Not internally tested by R&D Systems.
 View Larger
Detection of Human HIF-1 alpha by Western Blot Increasing doses of Allopurinol reduce HIF-1 alpha levels in hypoxic HFFs, without changing HIF mRNA levels but have reduced effect in HUVEC cells.A. Cells were pre-treated with Allopurinol at 10, 100 and 1000 μg/ml for 5, 30 and 60 minutes then were incubated in 1% oxygen for 16 hours. The cells were lysed for assessment of the indicated proteins. HIF-1 alpha levels were quantified using ImageJ software and graph depicts mean and standard deviation of a minimum of three independent experiments. Anova t-test was performed and p values calculated as follows: *p<0.05; **p<0.01; ***p<0.001. B. HIF-1 alpha and HIF-2 alpha mRNA levels were analysed by quantitative PCR in HFF and HUVEC cells. Graph depicts the mean and standard deviation of a minimum of three independent experiments performed in duplicate. Anova t-test was performed and p values calculated as follows: *p<0.05; **p<0.01; ***p<0.001. Image collected and cropped by CiteAb from the following publication (https://dx.plos.org/10.1371/journal.pone.0123649), licensed under a CC-BY license. Not internally tested by R&D Systems.
 View Larger
Detection of Human HIF-1 alpha by Western Blot NQO1 enhances HIF-1 alpha expression.(a,b) RKO cells (a) and MDA-MB-231 cells (b) were exposed to 0.5% O2 for 8 h and harvested at the indicated times. Whole-cell lysates were analysed by immunoblotting for HIF-1 alpha, HIF-1 beta, NQO1 and beta -actin. SE, short exposure; LE, long exposure. (c,d) Various concentrations of pshNQO1 and pNQO1-myc-His6 (0–10 μg) were transiently transfected into RKO (c) and MDA-MB-231 (d) cells, respectively. After 48 h, the cells were exposed to 20 or 0.5% O2 for another 2 h, and then harvested. Whole-cell lysates were analysed by immunoblotting for HIF-1 alpha, NQO1 and beta -actin. EV indicates pshCont (c) and pCDNA3.1-myc-His6 (d). SE, short exposure; LE, long exposure. (e) pNQO1-myc-His6 was transiently transfected into RKO/pshNQO1 cells. After 48 h, the cells were exposed to 0.5% O2 for 2 h, and then harvested. Whole-cell lysates were analysed by immunoblotting for HIF-1 alpha, NQO1 and beta -actin. SE, short exposure; LE, long exposure. (f) Mouse embryonic fibroblast wild type and NQO1−/− cells were exposed to 20 or 0.5% O2 for 2 h and then harvested. Whole-cell lysates were analysed by immunoblotting for HIF-1 alpha, NQO1 and beta -actin. SE, short exposure; LE, long exposure. Image collected and cropped by CiteAb from the following publication (https://pubmed.ncbi.nlm.nih.gov/27966538), licensed under a CC-BY license. Not internally tested by R&D Systems.
Human/Mouse/Rat HIF-1 alpha/HIF1A Antibody Summary
Arg575-Asn826
Accession # Q16665.1
Applications
Please Note: Optimal dilutions should be determined by each laboratory for each application. General Protocols are available in the Technical Information section on our website.
Simple Western(1 µg/mL)
Immunoprecipitation(1-3 µg/500 µg cell lysate)
Background: HIF-1 alpha/HIF1A
The hypoxia-inducible transcription factor 1 alpha (HIF-1 alpha ) is the regulated member of the transcription factor heterodimer HIF-1. HIF-1 binds to hypoxia-response elements (HREs) in the promoters of many genes involved in adapting to an environment of insufficient oxygen or hypoxia. Hypoxic tissue environments occur in vascular and pulmonary diseases as well as cancer, which illustrates the broad impact of gene regulation by HIF-1 alpha.
Preparation and Storage
- 12 months from date of receipt, -20 to -70 °C as supplied.
- 1 month, 2 to 8 °C under sterile conditions after reconstitution.
- 6 months, -20 to -70 °C under sterile conditions after reconstitution.
参考图片
Detection of Human, Mouse, and Rat HIF‑1 alpha by Western Blot. Western blot shows lysates of MCF‑7 human breast cancer cell line, Balb‑3T3 mouse embryonic fibroblast cell line, and PC‑12 rat adrenal pheochromocytoma cell line untreated (-) or treated (+) with 150 μM CoCl2 for 8 hours. PVDF membrane was probed with 1 µg/mL of Human/Mouse/Rat HIF‑1 alpha Monoclonal Antibody, followed by HRP-conjugated Anti-Mouse IgG Secondary Antibody (Catalog # HAF007). A specific band was detected for HIF‑1 alpha at approximately 120 kDa (as indicated). This experiment was conducted under reducing conditions and using Immunoblot Buffer Group 1.
Detection of Human HIF‑1 alpha by Simple WesternTM. Simple Western lane view shows lysates of A549 human lung carcinoma cell line untreated (-) or treated (+) with Hypoxia (1% O2), loaded at 0.2 mg/mL. A specific band was detected for HIF‑1 alpha at approximately 116 kDa (as indicated) using 1 µg/mL of Mouse Anti-Human/Mouse/Rat HIF‑1 alpha Monoclonal Antibody (Catalog # MAB1536). This experiment was conducted under reducing conditions and using the 12-230 kDa separation system.

 危险品化学品经营许可证(不带存储) 许可证编号:沪(杨)应急管危经许[2022]202944(QY)
  营业执照(三证合一)