


 下载产品说明书 下载SDS
 用小程序,查商品更便捷


 收藏
收藏
 对比
对比 咨询
咨询Scientific Data

 View Larger
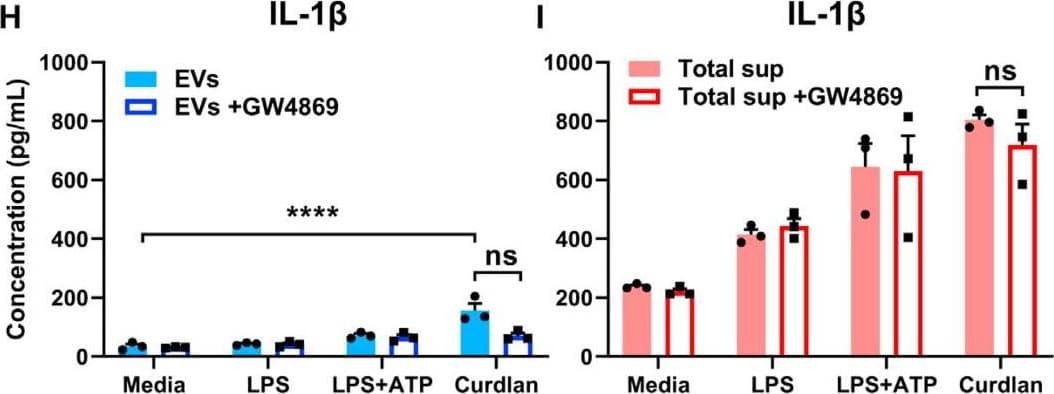
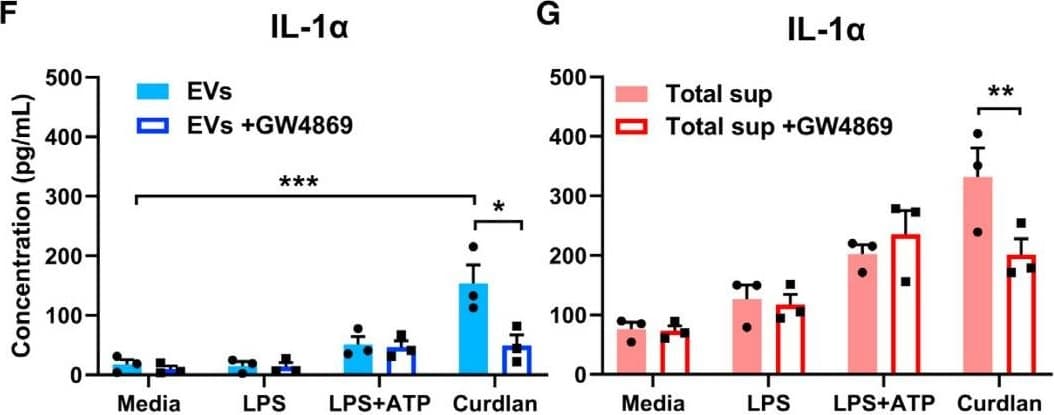
Detection of Mouse IL-1 beta/IL-1F2 by ELISA Exosomal release of IL-1 alpha by neutrophils(A) Representative confocal images of peritoneal neutrophils stimulated with LPS or curdlan for 6 h.(B) Quantification of IL-1 alpha and CD63 co-localization using ImageJ (each data point represents a single cell).(C) NTA of EV size distribution and concentration.(D–G) Neutrophils were stimulated in the presence of exosome inhibitor GW4869, and IL-1 alpha and IL-1 beta were quantified by ELISA in isolated EVs following lysis (D and F) and in total cell-free supernatants (E and G).(H) Inhibition of EV secretion shown by NTA.(I) Bioactive IL-1 signaling through IL-1R1 reporter cells was measured in isolated exosomes in the absence of detergent lysis (n = 4). Neutralizing antibodies (Abs) to IL-1 alpha, IL-1 beta, or both cytokines were included in the reporter assay, and bioactive cytokine concentration was calculated based on a standard curve using recombinant IL-1 alpha and IL-1 beta.Two-way ANOVA with Tukey’s multiple comparisons test. *p < 0.05, **p < 0.01, ***p < 0.001, ****p < 0.0001. Experiments in (A) and (B) were repeated three times; (C)–(G) are biological replicates from repeat experiments. Image collected and cropped by CiteAb from the following publication (https://pubmed.ncbi.nlm.nih.gov/34010648), licensed under a CC-BY license. Not internally tested by R&D Systems.
 View Larger
Detection of Mouse IL-1 beta/IL-1F2 by ELISA Exosomal release of IL-1 alpha by neutrophils(A) Representative confocal images of peritoneal neutrophils stimulated with LPS or curdlan for 6 h.(B) Quantification of IL-1 alpha and CD63 co-localization using ImageJ (each data point represents a single cell).(C) NTA of EV size distribution and concentration.(D–G) Neutrophils were stimulated in the presence of exosome inhibitor GW4869, and IL-1 alpha and IL-1 beta were quantified by ELISA in isolated EVs following lysis (D and F) and in total cell-free supernatants (E and G).(H) Inhibition of EV secretion shown by NTA.(I) Bioactive IL-1 signaling through IL-1R1 reporter cells was measured in isolated exosomes in the absence of detergent lysis (n = 4). Neutralizing antibodies (Abs) to IL-1 alpha, IL-1 beta, or both cytokines were included in the reporter assay, and bioactive cytokine concentration was calculated based on a standard curve using recombinant IL-1 alpha and IL-1 beta.Two-way ANOVA with Tukey’s multiple comparisons test. *p < 0.05, **p < 0.01, ***p < 0.001, ****p < 0.0001. Experiments in (A) and (B) were repeated three times; (C)–(G) are biological replicates from repeat experiments. Image collected and cropped by CiteAb from the following publication (https://pubmed.ncbi.nlm.nih.gov/34010648), licensed under a CC-BY license. Not internally tested by R&D Systems.
Assay Procedure
GENERAL ELISA PROTOCOL
Plate Preparation
- Dilute the Capture Antibody to the working concentration in PBS without carrier protein. Immediately coat a 96-well microplate with 100 μL per well of the diluted Capture Antibody. Seal the plate and incubate overnight at room temperature.
- Aspirate each well and wash with Wash Buffer, repeating the process two times for a total of three washes. Wash by filling each well with Wash Buffer (400 μL) using a squirt bottle, manifold dispenser, or autowasher. Complete removal of liquid at each step is essential for good performance. After the last wash, remove any remaining Wash Buffer by aspirating or by inverting the plate and blotting it against clean paper towels.
- Block plates by adding 300 μL of Reagent Diluent to each well. Incubate at room temperature for a minimum of 1 hour.
- Repeat the aspiration/wash as in step 2. The plates are now ready for sample addition.
Assay Procedure
- Add 100 μL of sample or standards in Reagent Diluent, or an appropriate diluent, per well. Cover with an adhesive strip and incubate 2 hours at room temperature.
- Repeat the aspiration/wash as in step 2 of Plate Preparation.
- Add 100 μL of the Detection Antibody, diluted in Reagent Diluent, to each well. Cover with a new adhesive strip and incubate 2 hours at room temperature.
- Repeat the aspiration/wash as in step 2 of Plate Preparation.
- Add 100 μL of the working dilution of Streptavidin-HRP to each well. Cover the plate and incubate for 20 minutes at room temperature. Avoid placing the plate in direct light.
- Repeat the aspiration/wash as in step 2.
- Add 100 μL of Substrate Solution to each well. Incubate for 20 minutes at room temperature. Avoid placing the plate in direct light.
- Add 50 μL of Stop Solution to each well. Gently tap the plate to ensure thorough mixing.
- Determine the optical density of each well immediately, using a microplate reader set to 450 nm. If wavelength correction is available, set to 540 nm or 570 nm. If wavelength correction is not available, subtract readings at 540 nm or 570 nm from the readings at 450 nm. This subtraction will correct for optical imperfections in the plate. Readings made directly at 450 nm without correction may be higher and less accurate.
Mouse IL-1 beta/IL-1F2 DuoSet ELISA Summary
* Provided that the recommended microplates, buffers, diluents, substrates and solutions are used, and the assay is run as summarized in the Assay Procedure provided.
This DuoSet ELISA Development kit contains the basic components required for the development of sandwich ELISAs to measure natural and recombinant mouse IL-1 beta/IL-1F2. The suggested diluent is suitable for the analysis of most cell culture supernate samples. Diluents for complex matrices, such as serum and plasma, should be evaluated prior to use in this DuoSet.

Background: IL-1 beta/IL-1F2
The Interleukin 1 (IL-1) family of proteins consists of IL-1 alpha, IL-1 beta, and the IL-1 receptor antagonist (IL-1ra). IL-1 alpha and IL-1 beta bind to the same cell surface receptors and share biological functions (1). IL-1 is not produced by unstimulated cells of healthy individuals with the exception of skin keratinocytes, some epithelial cells, and certain cells of the central nervous system. However, in response to inflammatory agents, infections, or microbial endotoxins, a dramatic increase in the production of IL-1 by macrophages and various other cell types is seen. IL-1 beta plays a central role in immune and inflammatory responses, bone remodeling, fever, carbohydrate metabolism, and GH/IGF-I physiology. Inappropriate or prolonged production of IL-1 has been implicated in a variety of pathological conditions including sepsis, rheumatoid arthritis, inflammatory bowel disease, acute and chronic myelogenous leukemia, insulindependent diabetes mellitus, atherosclerosis, neuronal injury, and aging-related diseases (2-5).

 危险品化学品经营许可证(不带存储) 许可证编号:沪(杨)应急管危经许[2022]202944(QY)
  营业执照(三证合一)