


BD Horizon™ BV605 Mouse Anti-Human IL-2


 下载产品说明书
 用小程序,查商品更便捷


 收藏
收藏
 对比
对比 咨询
咨询
参考图片
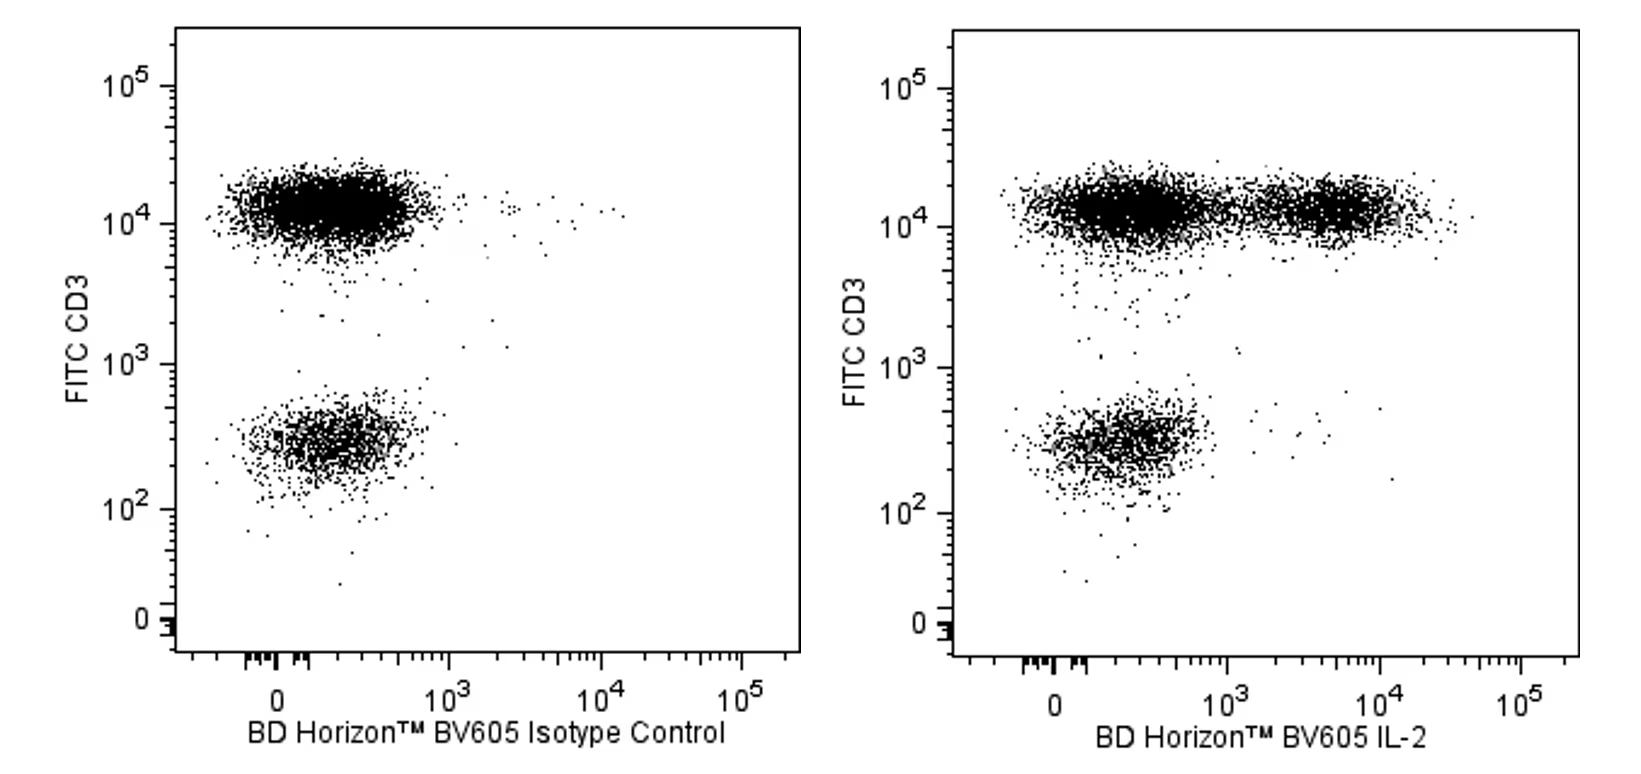
Two color flow cytometric analysis of IL-2 expression by activated human peripheral blood lymphocytes. Human peripheral blood mononuclear cells were stimulated for 5 h with Phorbol 12-Myristate 13-Acetate (PMA, Sigma P-8139; 50 ng/ml) and Calcium Ionophore A23187 (Sigma C-9275; 1 μ g/ml), in the presence of BD GolgiStop™ Protein Transport Inhibitor (containing Monensin) (Cat. No. 554724). The cells were fixed with BD Cytofix/Cytoperm™ Fixation and Permeabilization Solution (Cat. No. 554722), washed and permeabilized with BD Perm/Wash™ Buffer (Cat. No. 554723), and then stained with FITC Mouse Anti-Human CD3 antibody (Cat No. 555332/561806/561807) and either BD Horizon™ BV605 Mouse IgG1, κ Isotype Control (Cat No. 562652, Left Panel) or BD Horizon™ BV605 Mouse Anti-Human IL-2 antibody (Cat No. 563947, Right Panel) by using BD Biosciences Intracellular Cytokine Staining Protocol. The two-color flow cytometric dot plots show the correlated expression of IL-2 (or Ig Isotype control staining) versus CD3 and were derived from gated events with the forward and side light-scatter characteristics of intact lymphocytes. Flow cytometric analysis was performed using a BD™ LSR II Flow Cytometer System.
Two color flow cytometric analysis of IL-2 expression by activated human peripheral blood lymphocytes. Human peripheral blood mononuclear cells were stimulated for 5 h with Phorbol 12-Myristate 13-Acetate (PMA, Sigma P-8139; 50 ng/ml) and Calcium Ionophore A23187 (Sigma C-9275; 1 μ g/ml), in the presence of BD GolgiStop™ Protein Transport Inhibitor (containing Monensin) (Cat. No. 554724). The cells were fixed with BD Cytofix/Cytoperm™ Fixation and Permeabilization Solution (Cat. No. 554722), washed and permeabilized with BD Perm/Wash™ Buffer (Cat. No. 554723), and then stained with FITC Mouse Anti-Human CD3 antibody (Cat No. 555332/561806/561807) and either BD Horizon™ BV605 Mouse IgG1, κ Isotype Control (Cat No. 562652, Left Panel) or BD Horizon™ BV605 Mouse Anti-Human IL-2 antibody (Cat No. 563947, Right Panel) by using BD Biosciences Intracellular Cytokine Staining Protocol. The two-color flow cytometric dot plots show the correlated expression of IL-2 (or Ig Isotype control staining) versus CD3 and were derived from gated events with the forward and side light-scatter characteristics of intact lymphocytes. Flow cytometric analysis was performed using a BD™ LSR II Flow Cytometer System.

 危险品化学品经营许可证(不带存储) 许可证编号:沪(杨)应急管危经许[2022]202944(QY)
  营业执照(三证合一)