


 下载产品说明书 下载SDS
 用小程序,查商品更便捷


 收藏
收藏
 对比
对比 咨询
咨询Simple Western(10 µg/mL)
Immunocytochemistry(8-25 µg/mL)
Simple Western(10 µg/mL)
Immunocytochemistry(8-25 µg/mL)

Scientific Data
 View Larger
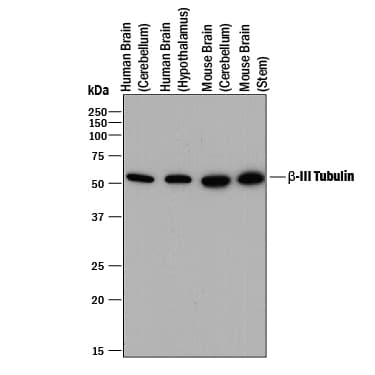
Detection of Human and Mouse beta ‑III Tubulin by Western Blot. Western blot shows lysates of human brain (cerebellum) tissue, human brain (hypothalamus) tissue, mouse brain (cerebellum) tissue, and mouse brain (stem) tissue. PVDF membrane was probed with 0.2 µg/mL of Mouse Anti-Neuron-specific beta -III Tubulin Monoclonal Antibody (Catalog # MAB1195) followed by HRP-conjugated Anti-Mouse IgG Secondary Antibody (HAF018). A specific band was detected for beta -III Tubulin at approximately 55 kDa (as indicated). This experiment was conducted under reducing conditions and using Immunoblot Buffer Group 1.
.") View Larger
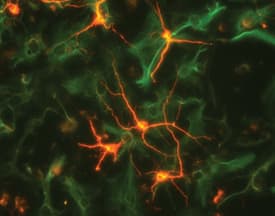
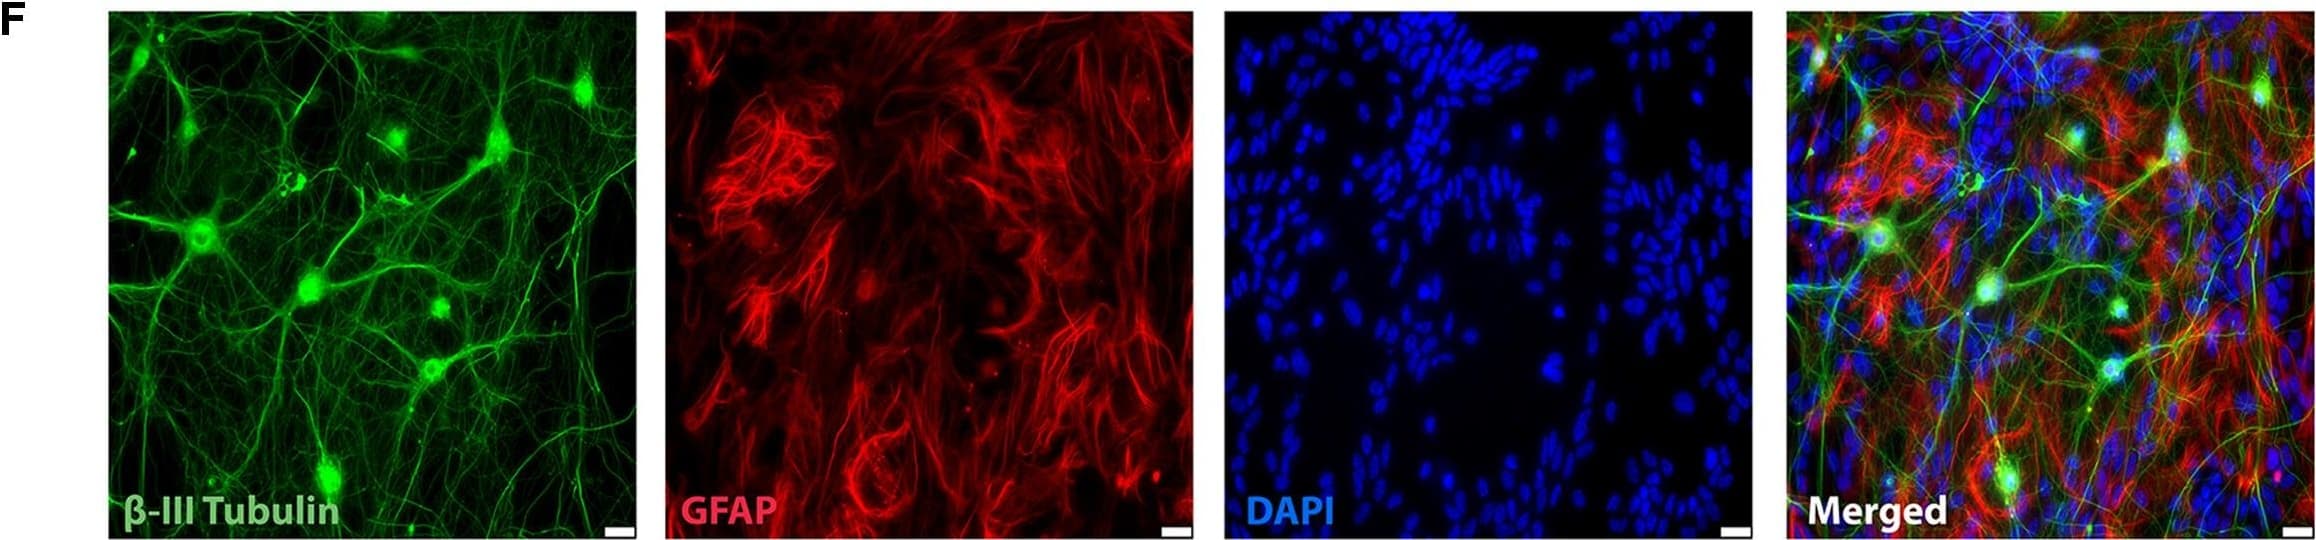
View Largerbeta ‑III Tubulin in Rat Cortical Neurons and GFAP in Rat Astrocytes. beta -III Tubulin was detected in rat cortical neurons using 5 µg/mL neuron-specific Mouse Anti-Neuron-specific beta -III Tubulin Monoclonal Antibody (Catalog # MAB1195). GFAP was detected in rat astrocytes using 10 µg/mL Human GFAP Antigen Affinity-purified Polyclonal Antibody (AF2594). Cells were incubated with primary antibodies for 3 hours at room temperature. Cells were stained for beta-III Tubulin using the NorthernLights™ 557-conjugated Anti-Mouse IgG Secondary Antibody (red; NL007) and for GFAP using the NorthernLights 493-conjugated Anti-Sheep IgG Secondary Antibody (green; NL012). View our protocol for Fluorescent ICC Staining of Cells on Coverslips.
.") View Larger
View Largerbeta ‑III Tubulin in Differentiated Human Neural Progenitor Cells. beta ‑III Tubulin was detected in immersion fixed differentiated human neural progenitor cells using Mouse Anti-Neuron-specific beta ‑III Tubulin Monoclonal Antibody (clone TuJ-1) (Catalog # MAB1195) for 3 hours at room temperature. Cells were stained (green) and counterstained (red). View our protocol for Fluorescent ICC Staining of Cells on Coverslips.
.") View Larger
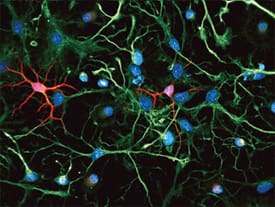
View Largerbeta ‑III Tubulin and Nestin in Rat Cortical Stem Cells. beta -III Tubulin and Nestin were detected in rat cortical stem cells (Catalog # NSC001) using 5 µg/mL neuron-specific Mouse Anti-Neuron-specific beta -III Tubulin Monoclonal Antibody (Catalog # MAB1195) and 10 µg/mL Rat Nestin Antigen Affinity-purified Polyclonal Antibody (AF2736). Cells were incubated with primary antibodies for 3 hours at room temperature. Cells were stained for beta-III Tubulin using the NorthernLights™ 557-conjugated Anti-Mouse IgG Secondary Antibody (red; NL007) and for Nestin using the NorthernLights 493-conjugated Anti-Goat IgG Secondary Antibody (green; NL003). Tissue was counterstained with DAPI (blue). View our protocol for Fluorescent ICC Staining of Cells on Coverslips.
.") View Larger
View Largerbeta ‑III Tubulin in Human Brain. beta -III Tubulin was detected in immersion fixed paraffin-embedded sections of human brain (cerebellum) using Mouse Anti-Neuron-specific beta -III Tubulin Monoclonal Antibody (Catalog # MAB1195) at 8 µg/mL for 1 hour at room temperature followed by incubation with the Anti-Mouse IgG VisUCyte™ HRP Polymer Antibody (VC001). Tissue was stained using DAB (brown) and counterstained with hematoxylin (blue). Specific staining was localized to Purkinje neurons. View our protocol for IHC Staining with VisUCyte HRP Polymer Detection Reagents.
 View Larger
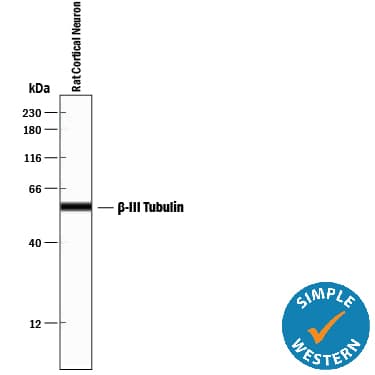
Detection of Rat beta ‑III Tubulin by Simple WesternTM. Simple Western lane view shows lysates of rat cortical neurons, loaded at 0.2 mg/mL. A specific band was detected for beta ‑III Tubulin at approximately 56 kDa (as indicated) using 10 µg/mL of Mouse Anti-Neuron-specific beta ‑III Tubulin Monoclonal Antibody (Catalog # MAB1195). This experiment was conducted under reducing conditions and using the 12-230 kDa separation system.
 View Larger
Detection of beta ‑III Tubulin in Human Brain Cerebellum. beta ‑III Tubulin was detected in immersion fixed paraffin-embedded sections of Human Brain Cerebellum using Mouse Anti-Neuron-specific beta ‑III Tubulin Monoclonal Antibody (Catalog # MAB1195) at 1 µg/mL for 1 hour at room temperature followed by incubation with the Anti-Mouse IgG VisUCyte™ HRP Polymer Antibody (Catalog # VC001). Before incubation with the primary antibody, tissue was subjected to heat-induced epitope retrieval using VisUCyte Antigen Retrieval Reagent-Basic (Catalog # VCTS021). Tissue was stained using DAB (brown) and counterstained with hematoxylin (blue). Specific staining was localized to Purkinje neurons. View our protocol for IHC Staining with VisUCyte HRP Polymer Detection Reagents.
 View Larger
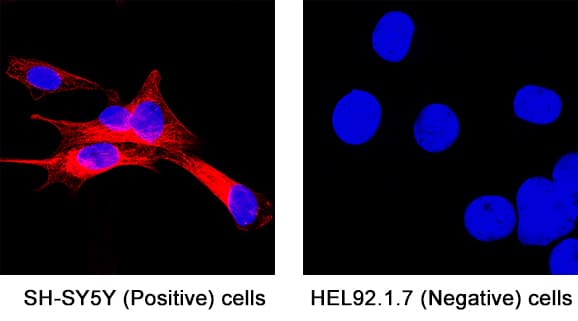
Detection of beta ‑III Tubulin in SH‑SY5Y cells (Positive) & HEL 92.1.7 cells (Negative). beta ‑III Tubulin was detected in immersion fixed SH‑SY5Y human neuroblastoma cells (Positive) & absent in HEL 92.1.7 human erythroleukemic cells (Negative) using Mouse Anti-Neuron-specific beta ‑III Tubulin Monoclonal Antibody (Catalog # MAB1195) at 0.5 µg/mL for 3 hours at room temperature. Cells were stained using the NorthernLights™ 557-conjugated Anti-Mouse IgG Secondary Antibody (red; Catalog # NL007) and counterstained with DAPI (blue). Specific staining was localized to cell cytoplasm. View our protocol for Fluorescent ICC Staining of Non-adherent Cells.
 View Larger
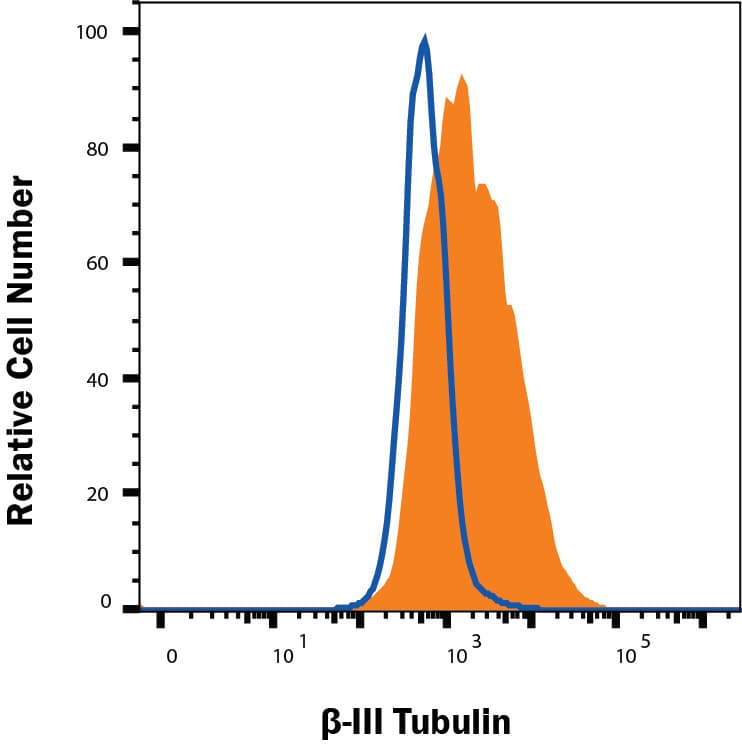
Detection of beta ‑III Tubulin in HepG2 cells by Flow Cytometry. HepG2 cells were stained with Mouse Anti-Neuron-specific beta ‑III Tubulin Monoclonal Antibody (Catalog # MAB1195, filled histogram) or isotype control antibody (Catalog # MAB003, open histogram), followed by Allophycocyanin-conjugated Anti-Mouse IgG Secondary Antibody (Catalog # F0101B). To facilitate intracellular staining, cells were fixed and permeabilized with FlowX FoxP3 Fixation & Permeabilization Buffer Kit (Catalog # FC012). View our protocol for Staining Intracellular Molecules.
 View Larger
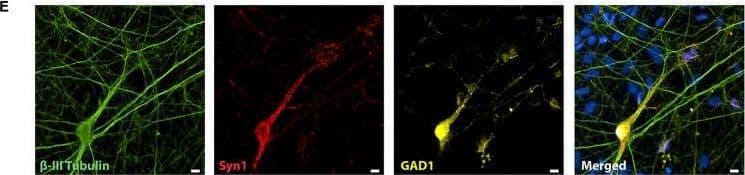
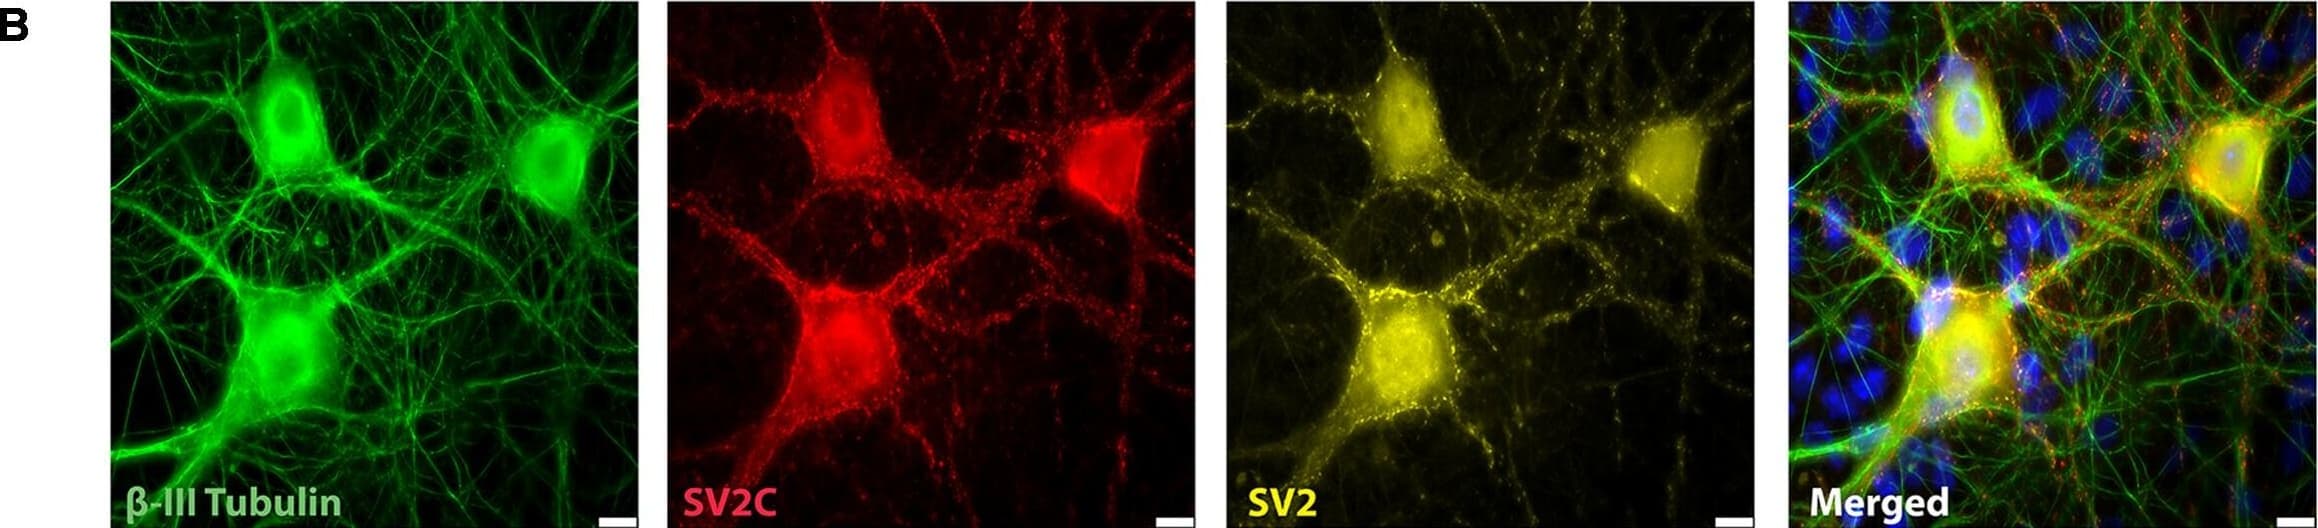
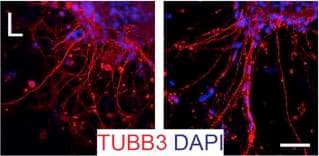
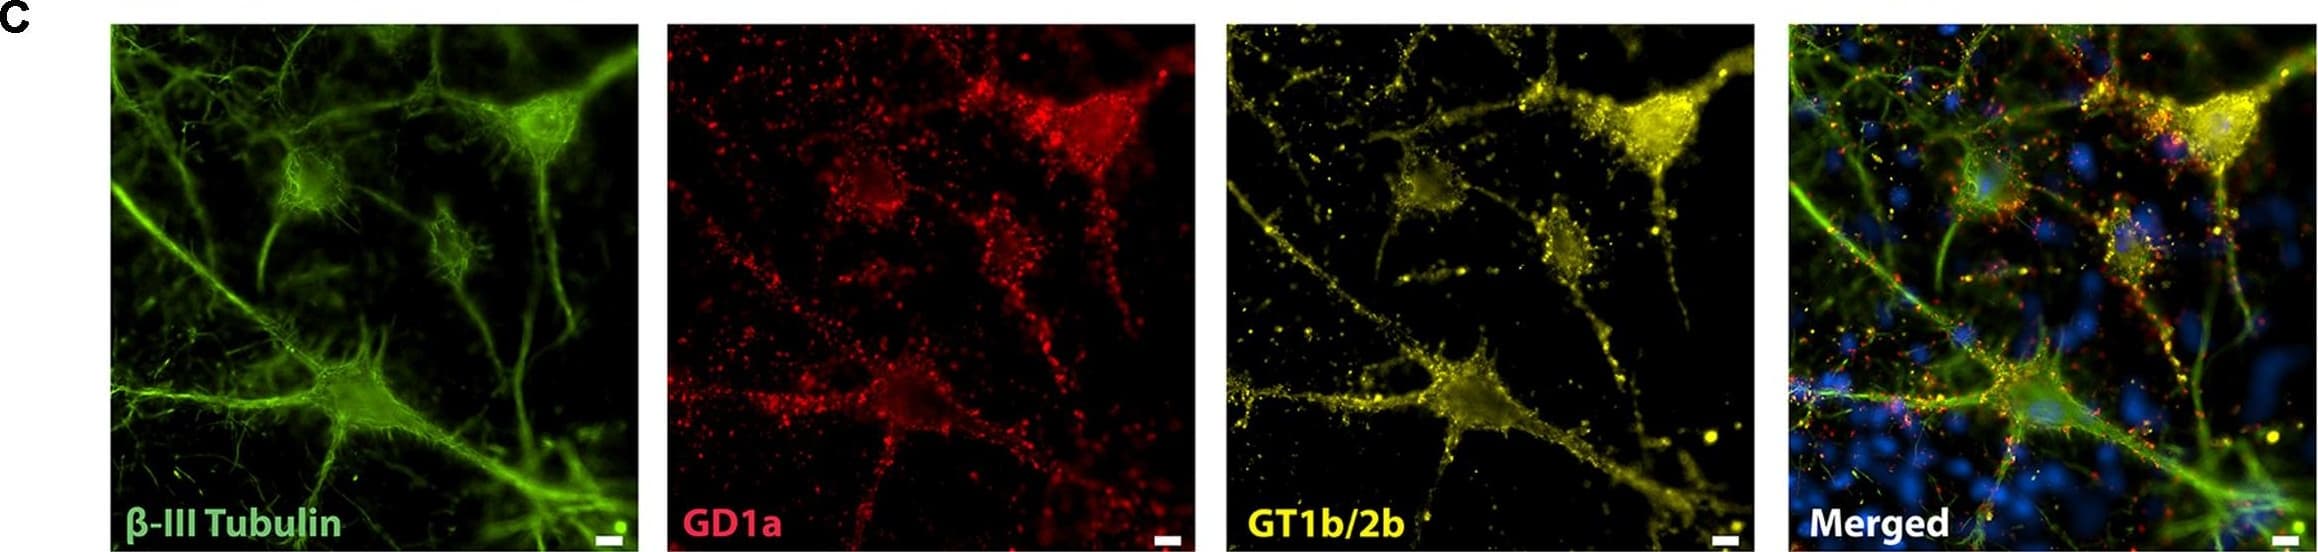
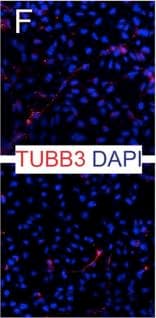
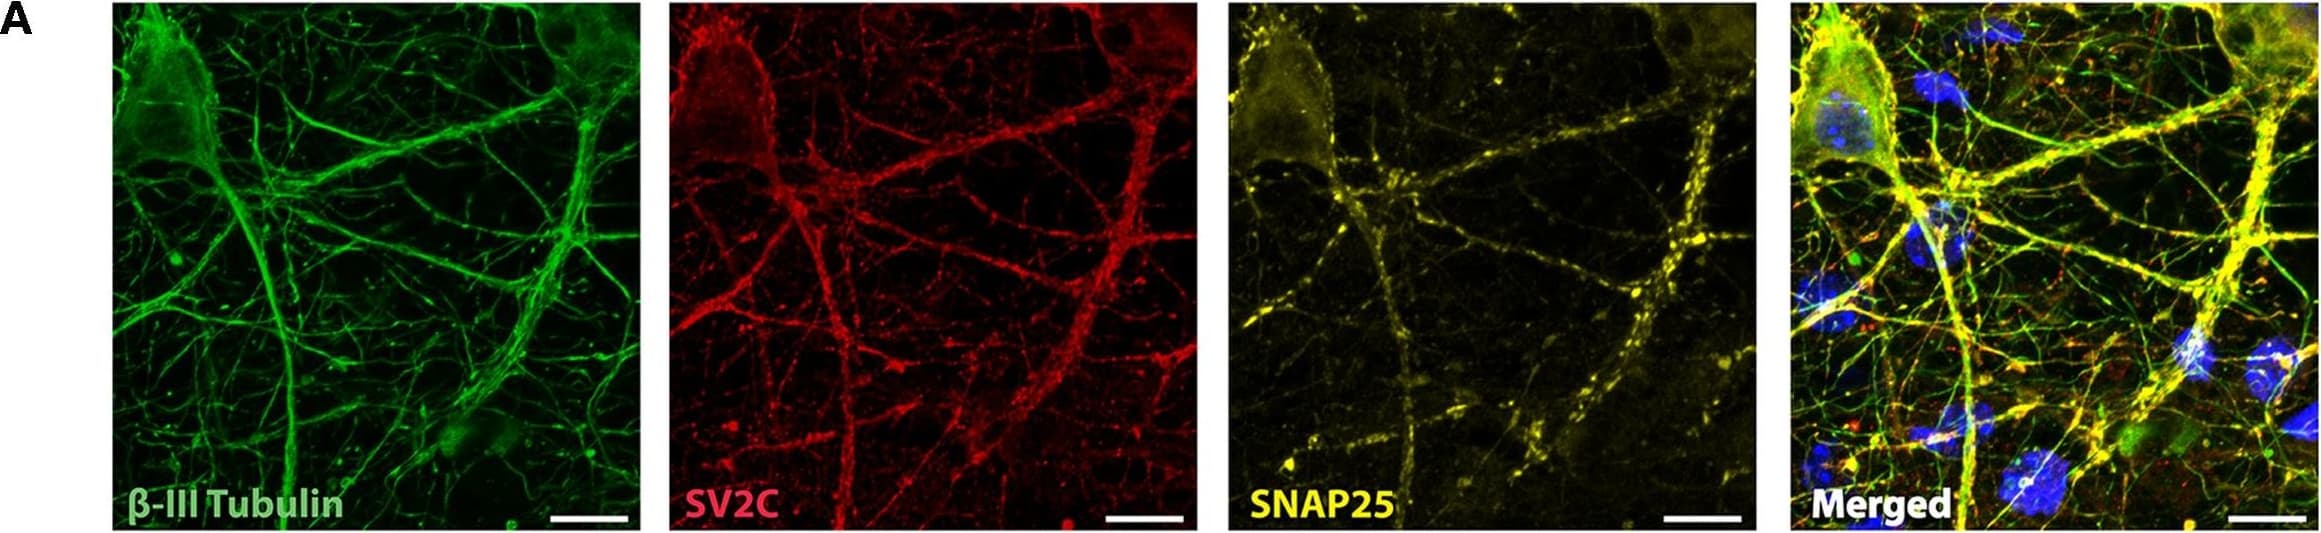
Detection of Mouse beta-III Tubulin by Immunocytochemistry/Immunofluorescence Representative immunocytochemistry demonstrating the expression of neuronal, synaptic, glutamatergic, GABAergic, and glial markers in cultures 21 days after plating. Neuronal cultures were immunostained against beta -III Tubulin (A–F); SNAP-25 (A); SV2 isoform A–C (A,B); polysialo gangliosides GD1a and GT1b/2b (C) Syn1 (D,E); glutamatergic neurons (VGLUT2, D); GABAergic neurons (GAD1, E) and glial cells (GFAP, F). Shown also are DAPI nuclear staining and the merged images. Scale bar is 10 μm (A–E), respectively, 25 μm for the bottom panel (F). Image collected and cropped by CiteAb from the following publication (https://pubmed.ncbi.nlm.nih.gov/28280466), licensed under a CC-BY license. Not internally tested by R&D Systems.
 View Larger
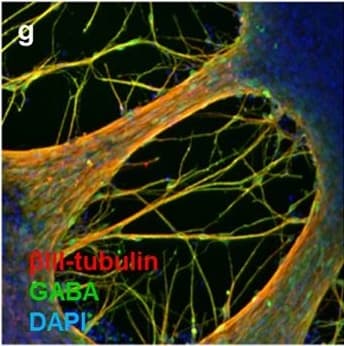
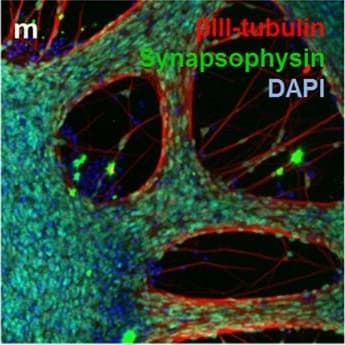
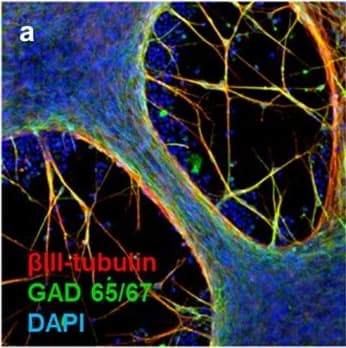
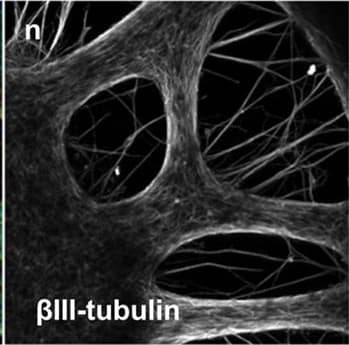
Detection of Human beta-III Tubulin by Immunocytochemistry/Immunofluorescence Neuronal markers expressed by iPSC-NSCs after differentiation and maturation on PEG hydrogels.(a) beta III-tubulin (red), GAD 65/67 (green), and DAPI (nuclei, blue). Single channel grayscale images from (a) are shown for (b) beta III-tubulin and (c) GAD 65/67. (d) VGLUT2 (red), MAP2 (green), and DAPI (nuclei, blue). Single channel grayscale images from (d) are shown for (e) VGLUT2 and (f) MAP2. (g) beta III-tubulin (red), GABA (green), and DAPI (nuclei, blue). Single channel grayscale images from (g) are shown for (h) beta III-tubulin and (i) GABA. (j) MNX1/HB9 (green) and DAPI (nuclei, blue). Single channel grayscale images from (j) are shown for (k) MNX1/HB9 and (l) DAPI. (m) beta III-tubulin (red), Synapsophysin (green), and DAPI (nuclei, blue). Single channel grayscale images from (m) are shown for (n) beta III-tubulin and (o) Synapsophysin. (p) Synapsin-1 (green) and DAPI (nuclei, blue). Single channel grayscale images from (p) are shown for (q) Synapsin-1 and (r) DAPI. Scale Bars: 200 μm. Image collected and cropped by CiteAb from the following publication (https://pubmed.ncbi.nlm.nih.gov/26411797), licensed under a CC-BY license. Not internally tested by R&D Systems.
 View Larger
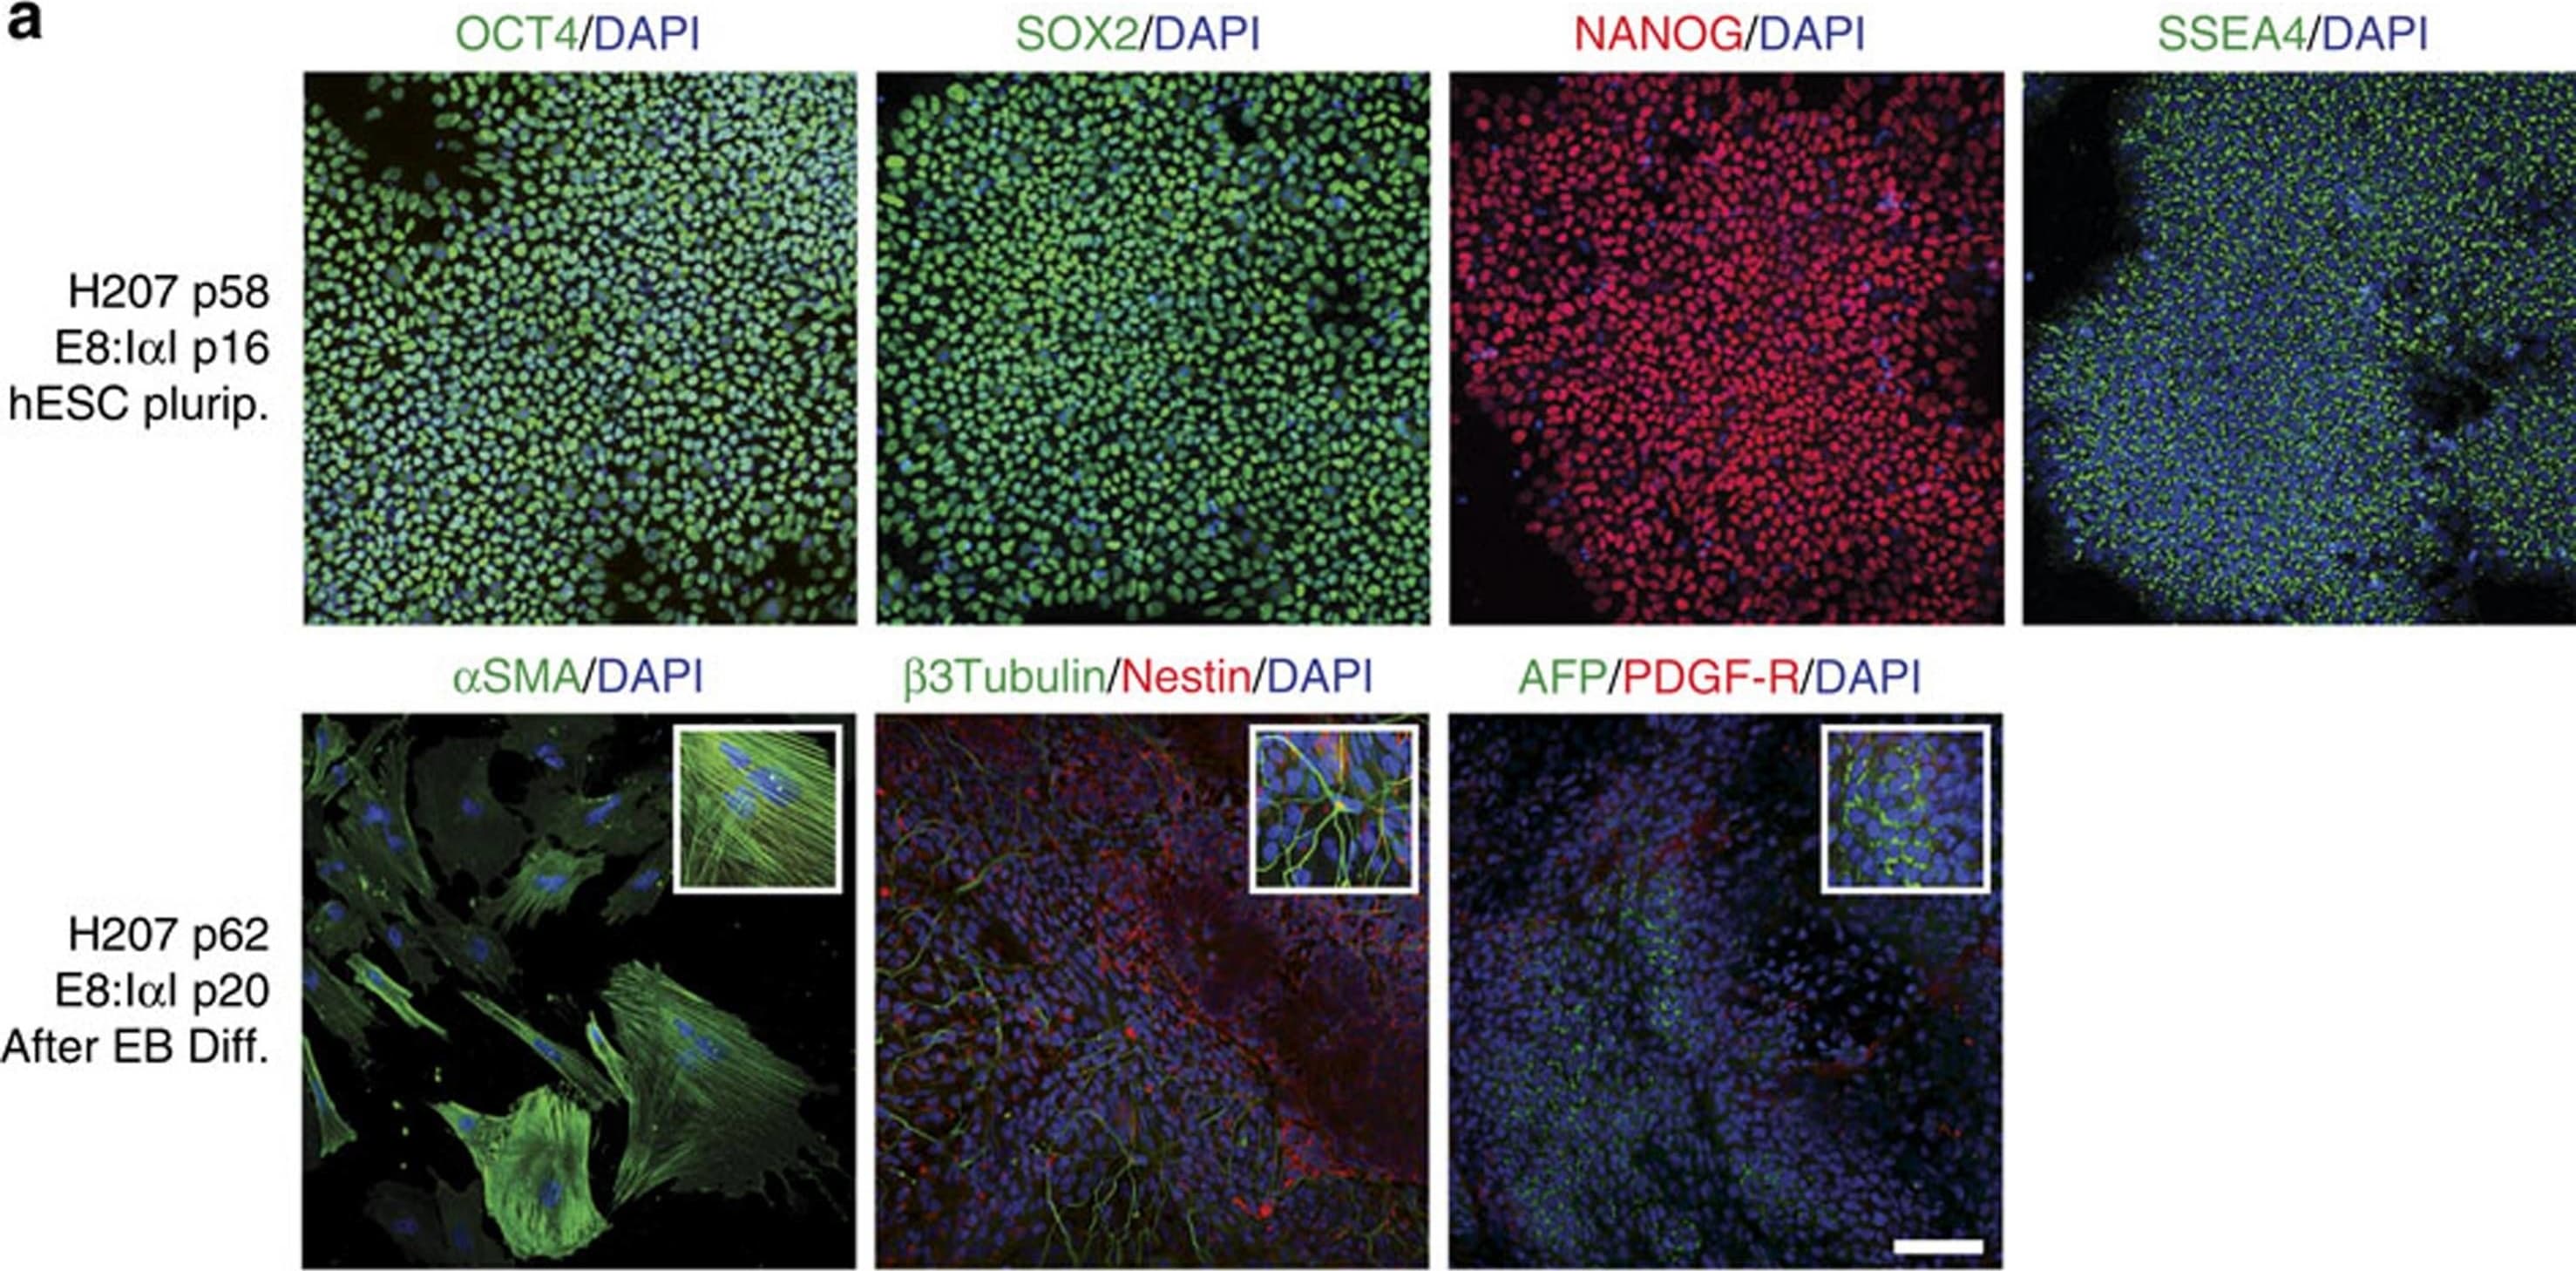
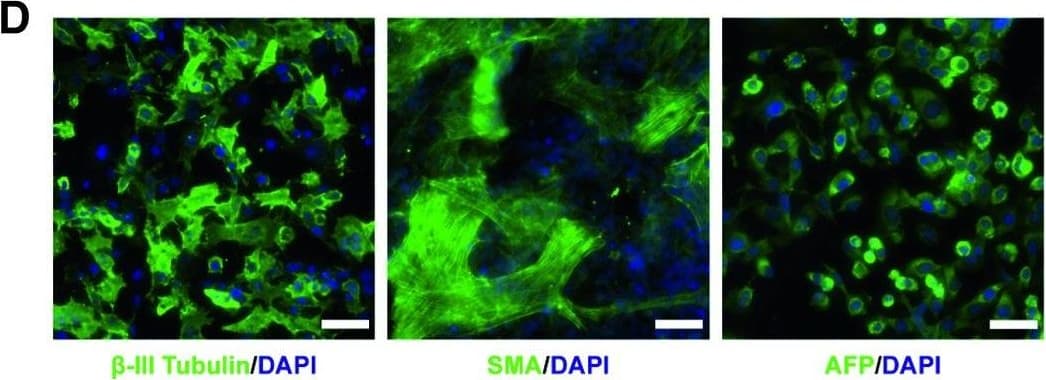
Detection of Human beta-III Tubulin by Immunocytochemistry/Immunofluorescence I alpha I maintains pluripotency and differentiation capacity in long-term culture.Immunofluorescence staining of H207 hES cell line for (a) stem cell markers Oct4 (green), Sox2 (green), Nanog (red) and SSEA-4 (green) after 16 passages in E8:I alpha I, and for the three germ layers after 4 weeks of differentiation through embryoid body (EB) formation: mesoderm with alpha smooth muscle actin (SMA, green), ectoderm with Nestin (red) and beta -III-tubulin (green) and endoderm with alpha-fetoprotein (AFP, green) and PDGF-receptor (red), and (b) after endoderm directed differentiation for endoderm markers Sox7 (red), Sox17 (green) and HNF3 beta (green) and stem cell markers Oct4 (green) and Nanog (red), as well as negative control with secondary antibodies. All samples were co-stained with DAPI (Blue) for nuclei detection. Scale bars show 100 μm, white boxes show close-up images. Image collected and cropped by CiteAb from the following publication (https://www.nature.com/articles/ncomms12170), licensed under a CC-BY license. Not internally tested by R&D Systems.
 View Larger
Detection of Human beta-III Tubulin by Immunocytochemistry/Immunofluorescence Neuronal markers expressed by iPSC-NSCs after differentiation and maturation on PEG hydrogels.(a) beta III-tubulin (red), GAD 65/67 (green), and DAPI (nuclei, blue). Single channel grayscale images from (a) are shown for (b) beta III-tubulin and (c) GAD 65/67. (d) VGLUT2 (red), MAP2 (green), and DAPI (nuclei, blue). Single channel grayscale images from (d) are shown for (e) VGLUT2 and (f) MAP2. (g) beta III-tubulin (red), GABA (green), and DAPI (nuclei, blue). Single channel grayscale images from (g) are shown for (h) beta III-tubulin and (i) GABA. (j) MNX1/HB9 (green) and DAPI (nuclei, blue). Single channel grayscale images from (j) are shown for (k) MNX1/HB9 and (l) DAPI. (m) beta III-tubulin (red), Synapsophysin (green), and DAPI (nuclei, blue). Single channel grayscale images from (m) are shown for (n) beta III-tubulin and (o) Synapsophysin. (p) Synapsin-1 (green) and DAPI (nuclei, blue). Single channel grayscale images from (p) are shown for (q) Synapsin-1 and (r) DAPI. Scale Bars: 200 μm. Image collected and cropped by CiteAb from the following publication (https://pubmed.ncbi.nlm.nih.gov/26411797), licensed under a CC-BY license. Not internally tested by R&D Systems.
 View Larger
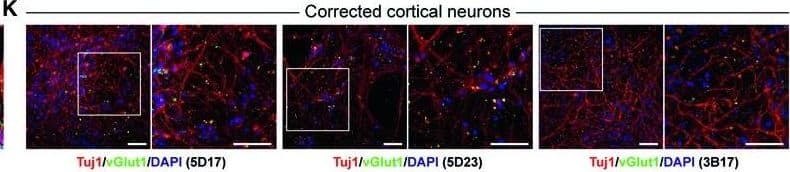
Detection of Human beta-III Tubulin by Immunocytochemistry/Immunofluorescence Characterization of NSCs and cortical neurons derived from FKRP‐ and CRISPR/Cas9 corrected‐iPSCsA, BRepresentative images of NSCs derived from FKRP‐ and corrected‐iPSC lines expressing SOX1, SOX2, and nestin.C, DQuantification of percentage of SOX1+ (C) and SOX2+ (D) cells in culture. The efficiency of neural induction is more than 99% in FKRP‐ and corrected‐iPSC (5D17, 5D23, and 3B17) lines. Data are mean ± s.d. n = 4 technical replicates.E, FFKRP‐ and corrected‐NSC lines can be further differentiated to cortical neural progenitor cells, expressing PAX6, OTX2, and vimentin.G–IQuantification of percentage of PAX6+ (G) and OTX2+ (H) cells in culture. About 91‐98% of cells derived from FKRP, 5D17, 5D23, and 3B17 NSC lines express PAX6 (G). About 93‐96% of cells derived from FKRP, 5D17, 5D23, and 3B17 NSC lines express OTX2 (H). Of the OTX2+ population, about 60‐67% cells are also Ki67+ cycling progenitors (I). Data are mean ± s.d. n = 4 technical replicates.J, KGlutamatergic projection neurons derived from FKRP and corrected (5D17, 5D23, and 3B17) progenitor cells. The vast majority of neurons contain vGlut1+ punctae in their neurites (labeled by Tuj1). Right panels are enlarged images from the insets of left panels.Data information: Scale bars, 50 μm. Image collected and cropped by CiteAb from the following publication (https://pubmed.ncbi.nlm.nih.gov/31566294), licensed under a CC-BY license. Not internally tested by R&D Systems.
 View Larger
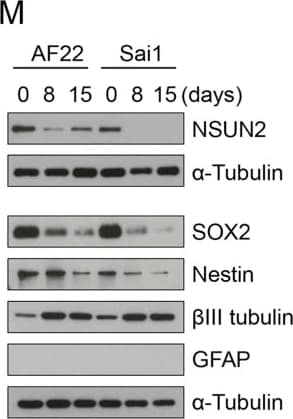
Detection of Human beta-III Tubulin by Immunocytochemistry/Immunofluorescence Expression of NSUN2 in the Human Developing Brain and NES Cells(A) DAPI-stained human embryo (6 weeks of gestation) marked for prosencephalon, mesencephalon, and rhombencephalon. Region in square is magnified in (B). Scale bar, 1 mm.(B) Prosencephalon labeled for NSUN2 and SOX1. Region in squares are magnified in (b′) and (b″). Arrows indicate NSUN2-positive cells. Scale bar, 100 μm.(C–F) Bright-field image (C) and immunofluorescence (D–F) of AF22 (upper panels) and Sai1 (lower panels) cells labeled for Nestin (D), SOX2 (E), and beta III-tubulin (F). Scale bar, 50 μm.(G and H) NES cells co-labeled for NSUN2 and Nestin (NES) (G) or SOX1 (H).(I) Differentiation protocol.(J–L) Differentiated AF22 and Sai1 cells (day 15) labeled for Nestin (NES; J), SOX2 (K), and beta III-tubulin (L). Scale bars: 50 μm.(M) Western blot for NSUN2, beta III-tubulin (TUBB3), GFAP, SOX2, and Nestin during differentiation (days). alpha -Tubulin served as loading control.Nuclei are counterstained with DAPI (A, B, D–F, J–L). Image collected and cropped by CiteAb from the following publication (https://linkinghub.elsevier.com/retrieve/pii/S2213671116302764), licensed under a CC-BY license. Not internally tested by R&D Systems.
 View Larger
Detection of Human beta-III Tubulin by Immunocytochemistry/Immunofluorescence Functional glycosylation of alpha ‐dystroglycan and characterization of dystroglycanopathy patient‐specific iPSCsCurrent model of the core M3 functional glycan structure on alpha ‐dystroglycan and enzymes involved in its synthesis. ECM ligands, such as laminins, bind to the Xyl‐GlucA disaccharide repeats (IIH6 epitope). Man, mannose; GlcNAc, N‐acetylglucosamine; GalNAc, N‐acetylgalactosamine; Rbo5P, ribitol‐5‐phosphate; Xyl, xylose; GlcA, glucuronic acid.Representative images of immunostaining demonstrate that FKRP‐iPSCs express specific pluripotency‐associated markers, including NANOG, OCT4, Tra‐1‐60, and SSEA4.FKRP‐iPSCs have a normal karyotype.In vitro differentiation of FKRP‐iPSCs to cells representing ectoderm ( beta ‐III Tubulin, Tuj1), mesoderm (SMA, smooth muscle actin), and endoderm (AFP, alpha ‐fetoprotein).Data information: Scale bars, 50 μm. Image collected and cropped by CiteAb from the following publication (https://pubmed.ncbi.nlm.nih.gov/31566294), licensed under a CC-BY license. Not internally tested by R&D Systems.
 View Larger
Detection of Mouse beta-III Tubulin by Immunocytochemistry/Immunofluorescence Representative immunocytochemistry demonstrating the expression of neuronal, synaptic, glutamatergic, GABAergic, and glial markers in cultures 21 days after plating. Neuronal cultures were immunostained against beta -III Tubulin (A–F); SNAP-25 (A); SV2 isoform A–C (A,B); polysialo gangliosides GD1a and GT1b/2b (C) Syn1 (D,E); glutamatergic neurons (VGLUT2, D); GABAergic neurons (GAD1, E) and glial cells (GFAP, F). Shown also are DAPI nuclear staining and the merged images. Scale bar is 10 μm (A–E), respectively, 25 μm for the bottom panel (F). Image collected and cropped by CiteAb from the following publication (https://pubmed.ncbi.nlm.nih.gov/28280466), licensed under a CC-BY license. Not internally tested by R&D Systems.
 View Larger
Detection of Human beta-III Tubulin by Western Blot Expression of NSUN2 in the Human Developing Brain and NES Cells(A) DAPI-stained human embryo (6 weeks of gestation) marked for prosencephalon, mesencephalon, and rhombencephalon. Region in square is magnified in (B). Scale bar, 1 mm.(B) Prosencephalon labeled for NSUN2 and SOX1. Region in squares are magnified in (b′) and (b″). Arrows indicate NSUN2-positive cells. Scale bar, 100 μm.(C–F) Bright-field image (C) and immunofluorescence (D–F) of AF22 (upper panels) and Sai1 (lower panels) cells labeled for Nestin (D), SOX2 (E), and beta III-tubulin (F). Scale bar, 50 μm.(G and H) NES cells co-labeled for NSUN2 and Nestin (NES) (G) or SOX1 (H).(I) Differentiation protocol.(J–L) Differentiated AF22 and Sai1 cells (day 15) labeled for Nestin (NES; J), SOX2 (K), and beta III-tubulin (L). Scale bars: 50 μm.(M) Western blot for NSUN2, beta III-tubulin (TUBB3), GFAP, SOX2, and Nestin during differentiation (days). alpha -Tubulin served as loading control.Nuclei are counterstained with DAPI (A, B, D–F, J–L). Image collected and cropped by CiteAb from the following publication (https://linkinghub.elsevier.com/retrieve/pii/S2213671116302764), licensed under a CC-BY license. Not internally tested by R&D Systems.
 View Larger
Detection of Human beta-III Tubulin by Immunocytochemistry/Immunofluorescence Characterization of NSCs and cortical neurons derived from FKRP‐ and CRISPR/Cas9 corrected‐iPSCsA, BRepresentative images of NSCs derived from FKRP‐ and corrected‐iPSC lines expressing SOX1, SOX2, and nestin.C, DQuantification of percentage of SOX1+ (C) and SOX2+ (D) cells in culture. The efficiency of neural induction is more than 99% in FKRP‐ and corrected‐iPSC (5D17, 5D23, and 3B17) lines. Data are mean ± s.d. n = 4 technical replicates.E, FFKRP‐ and corrected‐NSC lines can be further differentiated to cortical neural progenitor cells, expressing PAX6, OTX2, and vimentin.G–IQuantification of percentage of PAX6+ (G) and OTX2+ (H) cells in culture. About 91‐98% of cells derived from FKRP, 5D17, 5D23, and 3B17 NSC lines express PAX6 (G). About 93‐96% of cells derived from FKRP, 5D17, 5D23, and 3B17 NSC lines express OTX2 (H). Of the OTX2+ population, about 60‐67% cells are also Ki67+ cycling progenitors (I). Data are mean ± s.d. n = 4 technical replicates.J, KGlutamatergic projection neurons derived from FKRP and corrected (5D17, 5D23, and 3B17) progenitor cells. The vast majority of neurons contain vGlut1+ punctae in their neurites (labeled by Tuj1). Right panels are enlarged images from the insets of left panels.Data information: Scale bars, 50 μm. Image collected and cropped by CiteAb from the following publication (https://pubmed.ncbi.nlm.nih.gov/31566294), licensed under a CC-BY license. Not internally tested by R&D Systems.
 View Larger
Detection of Mouse beta-III Tubulin by Immunocytochemistry/Immunofluorescence Representative immunocytochemistry demonstrating the expression of neuronal, synaptic, glutamatergic, GABAergic, and glial markers in cultures 21 days after plating. Neuronal cultures were immunostained against beta -III Tubulin (A–F); SNAP-25 (A); SV2 isoform A–C (A,B); polysialo gangliosides GD1a and GT1b/2b (C) Syn1 (D,E); glutamatergic neurons (VGLUT2, D); GABAergic neurons (GAD1, E) and glial cells (GFAP, F). Shown also are DAPI nuclear staining and the merged images. Scale bar is 10 μm (A–E), respectively, 25 μm for the bottom panel (F). Image collected and cropped by CiteAb from the following publication (https://pubmed.ncbi.nlm.nih.gov/28280466), licensed under a CC-BY license. Not internally tested by R&D Systems.
 View Larger
Detection of Human beta-III Tubulin by Immunocytochemistry/Immunofluorescence Neuronal markers expressed by iPSC-NSCs after differentiation and maturation on PEG hydrogels.(a) beta III-tubulin (red), GAD 65/67 (green), and DAPI (nuclei, blue). Single channel grayscale images from (a) are shown for (b) beta III-tubulin and (c) GAD 65/67. (d) VGLUT2 (red), MAP2 (green), and DAPI (nuclei, blue). Single channel grayscale images from (d) are shown for (e) VGLUT2 and (f) MAP2. (g) beta III-tubulin (red), GABA (green), and DAPI (nuclei, blue). Single channel grayscale images from (g) are shown for (h) beta III-tubulin and (i) GABA. (j) MNX1/HB9 (green) and DAPI (nuclei, blue). Single channel grayscale images from (j) are shown for (k) MNX1/HB9 and (l) DAPI. (m) beta III-tubulin (red), Synapsophysin (green), and DAPI (nuclei, blue). Single channel grayscale images from (m) are shown for (n) beta III-tubulin and (o) Synapsophysin. (p) Synapsin-1 (green) and DAPI (nuclei, blue). Single channel grayscale images from (p) are shown for (q) Synapsin-1 and (r) DAPI. Scale Bars: 200 μm. Image collected and cropped by CiteAb from the following publication (https://pubmed.ncbi.nlm.nih.gov/26411797), licensed under a CC-BY license. Not internally tested by R&D Systems.
 View Larger
Detection of Mouse beta-III Tubulin by Immunocytochemistry/Immunofluorescence Representative immunocytochemistry demonstrating the expression of neuronal, synaptic, glutamatergic, GABAergic, and glial markers in cultures 21 days after plating. Neuronal cultures were immunostained against beta -III Tubulin (A–F); SNAP-25 (A); SV2 isoform A–C (A,B); polysialo gangliosides GD1a and GT1b/2b (C) Syn1 (D,E); glutamatergic neurons (VGLUT2, D); GABAergic neurons (GAD1, E) and glial cells (GFAP, F). Shown also are DAPI nuclear staining and the merged images. Scale bar is 10 μm (A–E), respectively, 25 μm for the bottom panel (F). Image collected and cropped by CiteAb from the following publication (https://pubmed.ncbi.nlm.nih.gov/28280466), licensed under a CC-BY license. Not internally tested by R&D Systems.
 View Larger
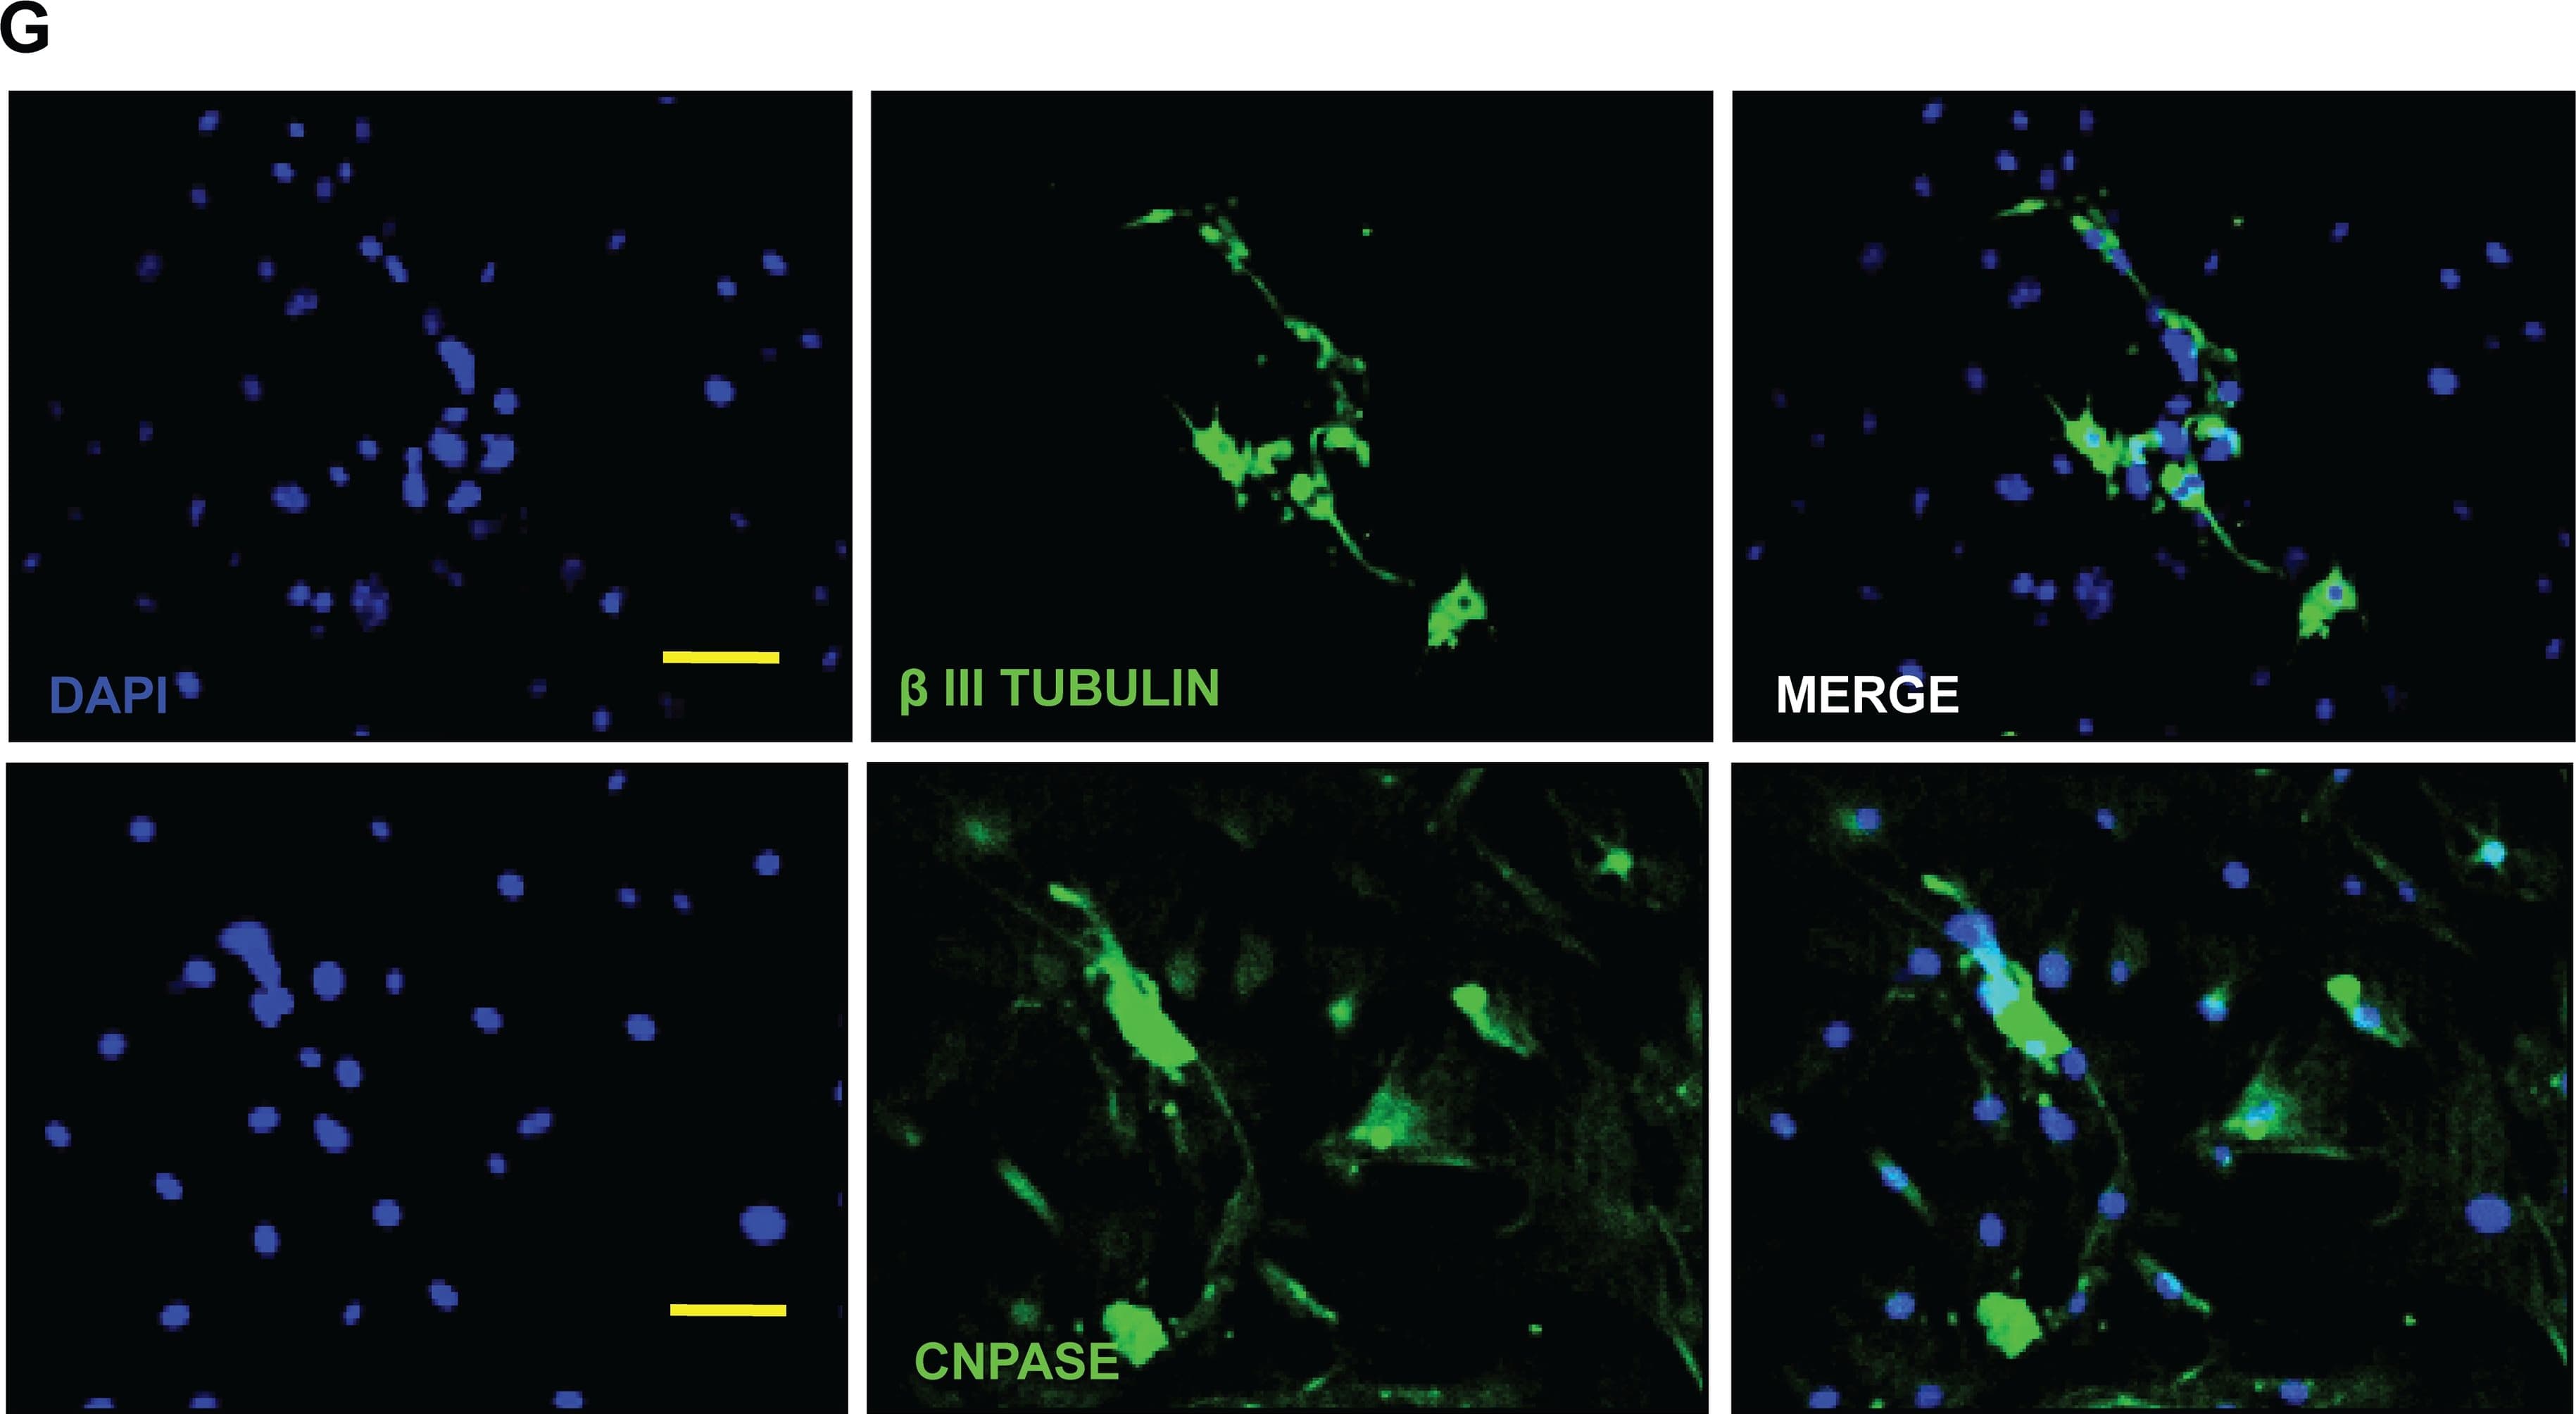
Detection of Mouse beta-III Tubulin by Immunocytochemistry/Immunofluorescence Differentiation of murine skin stem cell precursors (SKP).The differentiation of SKPs was induced through the dissociation of cell aggregates into single cells followed by serum exposure and, as may be seen in the micrographs after 7 days (A), 14 days (B) and 21 days (C), these cells presented several elongated extensions. The mRNA levels of astrocyte markers (D) GFAP; oligodendrocytes (E) CNPase; and neurons (F) beta III tubulin were measured by qRT-PCR and validated at the protein level (G) by immunofluorescence microscopy, Bar = 50μm. The results are presented as the mean ± SD of values obtained in three independent experiments performed in triplicates. Statistical analyzes were performed using ANOVA analysis of variance followed by Tukey test to post-Kramer. All groups were measured versus the undifferentiated control in the shortest time of differentiation, ns = not significant; * p ≤ 0.05; ** p≤0.001. Image collected and cropped by CiteAb from the following publication (https://dx.plos.org/10.1371/journal.pone.0140143), licensed under a CC-BY license. Not internally tested by R&D Systems.
 View Larger
Detection of Human beta-III Tubulin by Immunocytochemistry/Immunofluorescence Neuronal markers expressed by iPSC-NSCs after differentiation and maturation on PEG hydrogels.(a) beta III-tubulin (red), GAD 65/67 (green), and DAPI (nuclei, blue). Single channel grayscale images from (a) are shown for (b) beta III-tubulin and (c) GAD 65/67. (d) VGLUT2 (red), MAP2 (green), and DAPI (nuclei, blue). Single channel grayscale images from (d) are shown for (e) VGLUT2 and (f) MAP2. (g) beta III-tubulin (red), GABA (green), and DAPI (nuclei, blue). Single channel grayscale images from (g) are shown for (h) beta III-tubulin and (i) GABA. (j) MNX1/HB9 (green) and DAPI (nuclei, blue). Single channel grayscale images from (j) are shown for (k) MNX1/HB9 and (l) DAPI. (m) beta III-tubulin (red), Synapsophysin (green), and DAPI (nuclei, blue). Single channel grayscale images from (m) are shown for (n) beta III-tubulin and (o) Synapsophysin. (p) Synapsin-1 (green) and DAPI (nuclei, blue). Single channel grayscale images from (p) are shown for (q) Synapsin-1 and (r) DAPI. Scale Bars: 200 μm. Image collected and cropped by CiteAb from the following publication (https://pubmed.ncbi.nlm.nih.gov/26411797), licensed under a CC-BY license. Not internally tested by R&D Systems.
 View Larger
Detection of Human beta-III Tubulin by Immunocytochemistry/Immunofluorescence Expression of NSUN2 in the Human Developing Brain and NES Cells(A) DAPI-stained human embryo (6 weeks of gestation) marked for prosencephalon, mesencephalon, and rhombencephalon. Region in square is magnified in (B). Scale bar, 1 mm.(B) Prosencephalon labeled for NSUN2 and SOX1. Region in squares are magnified in (b′) and (b″). Arrows indicate NSUN2-positive cells. Scale bar, 100 μm.(C–F) Bright-field image (C) and immunofluorescence (D–F) of AF22 (upper panels) and Sai1 (lower panels) cells labeled for Nestin (D), SOX2 (E), and beta III-tubulin (F). Scale bar, 50 μm.(G and H) NES cells co-labeled for NSUN2 and Nestin (NES) (G) or SOX1 (H).(I) Differentiation protocol.(J–L) Differentiated AF22 and Sai1 cells (day 15) labeled for Nestin (NES; J), SOX2 (K), and beta III-tubulin (L). Scale bars: 50 μm.(M) Western blot for NSUN2, beta III-tubulin (TUBB3), GFAP, SOX2, and Nestin during differentiation (days). alpha -Tubulin served as loading control.Nuclei are counterstained with DAPI (A, B, D–F, J–L). Image collected and cropped by CiteAb from the following publication (https://linkinghub.elsevier.com/retrieve/pii/S2213671116302764), licensed under a CC-BY license. Not internally tested by R&D Systems.
 View Larger
Detection of Human beta-III Tubulin by Immunocytochemistry/Immunofluorescence Neuronal markers expressed by iPSC-NSCs after differentiation and maturation on PEG hydrogels.(a) beta III-tubulin (red), GAD 65/67 (green), and DAPI (nuclei, blue). Single channel grayscale images from (a) are shown for (b) beta III-tubulin and (c) GAD 65/67. (d) VGLUT2 (red), MAP2 (green), and DAPI (nuclei, blue). Single channel grayscale images from (d) are shown for (e) VGLUT2 and (f) MAP2. (g) beta III-tubulin (red), GABA (green), and DAPI (nuclei, blue). Single channel grayscale images from (g) are shown for (h) beta III-tubulin and (i) GABA. (j) MNX1/HB9 (green) and DAPI (nuclei, blue). Single channel grayscale images from (j) are shown for (k) MNX1/HB9 and (l) DAPI. (m) beta III-tubulin (red), Synapsophysin (green), and DAPI (nuclei, blue). Single channel grayscale images from (m) are shown for (n) beta III-tubulin and (o) Synapsophysin. (p) Synapsin-1 (green) and DAPI (nuclei, blue). Single channel grayscale images from (p) are shown for (q) Synapsin-1 and (r) DAPI. Scale Bars: 200 μm. Image collected and cropped by CiteAb from the following publication (https://pubmed.ncbi.nlm.nih.gov/26411797), licensed under a CC-BY license. Not internally tested by R&D Systems.
Neuron-specific beta -III Tubulin Antibody Summary
Applications
Please Note: Optimal dilutions should be determined by each laboratory for each application. General Protocols are available in the Technical Information section on our website.
Simple Western(10 µg/mL)
Immunocytochemistry(8-25 µg/mL)
Background: beta-III Tubulin
beta -III Tubulin, also known as tubulin beta -4, is regarded as a neuron-specific marker. The expression of beta -III Tubulin has been suggested to be one of the earliest markers to signal commitment in primitive neuroepithelium.
Preparation and Storage
- 12 months from date of receipt, -20 to -70 °C as supplied.
- 1 month, 2 to 8 °C under sterile conditions after reconstitution.
- 6 months, -20 to -70 °C under sterile conditions after reconstitution.
参考图片
Detection of Human and Mouse beta ‑III Tubulin by Western Blot. Western blot shows lysates of human brain (cerebellum) tissue, human brain (hypothalamus) tissue, mouse brain (cerebellum) tissue, and mouse brain (stem) tissue. PVDF membrane was probed with 0.2 µg/mL of Mouse Anti-Neuron-specific beta ‑III Tubulin Monoclonal Antibody (Catalog # MAB1195) followed by HRP-conjugated Anti-Mouse IgG Secondary Antibody (Catalog # HAF018). A specific band was detected for beta ‑III Tubulin at approximately 55 kDa (as indicated). This experiment was conducted under reducing conditions and using Immunoblot Buffer Group 1.
beta ‑III Tubulin in Differentiated Human Neural Progenitor Cells. beta ‑III Tubulin was detected in immersion fixed differentiated human neural progenitor cells using Mouse Anti-Neuron-specific beta ‑III Tubulin Monoclonal Antibody (clone TuJ-1) (Catalog # MAB1195) for 3 hours at room temperature. Cells were stained (green) and counterstained (red). View our protocol for Fluorescent ICC Staining of Cells on Coverslips.
beta ‑III Tubulin in Rat Cortical Neurons and GFAP in Rat Astrocytes. beta ‑III Tubulin was detected in rat cortical neurons using 5 µg/mL neuron-specific Mouse Anti-Neuron-specific beta ‑III Tubulin Monoclonal Antibody (Catalog # MAB1195). GFAP was detected in rat astrocytes using 10 µg/mL Human GFAP Antigen Affinity-purified Polyclonal Antibody (Catalog # AF2594). Cells were incubated with primary antibodies for 3 hours at room temperature. Cells were stained for
beta‑III Tubulin using the NorthernLights™ 557-conjugated Anti-Mouse IgG Secondary Antibody (red; Catalog # NL007) and for GFAP using the NorthernLights 493-conjugated Anti-Sheep IgG Secondary Antibody (green; Catalog # NL012). View our protocol for Fluorescent ICC Staining of Cells on Coverslips.
beta ‑III Tubulin and Nestin in Rat Cortical Stem Cells.
beta ‑III Tubulin and Nestin were detected in rat cortical stem cells (Catalog # NSC001) using 5 µg/mL neuron-specific Mouse Anti-Neuron-specific beta ‑III Tubulin Monoclonal Antibody (Catalog # MAB1195) and 10 µg/mL Rat Nestin Antigen Affinity-purified Polyclonal Antibody (Catalog # AF2736). Cells were incubated with primary antibodies for 3 hours at room temperature. Cells were stained for beta‑III Tubulin using the NorthernLights™ 557-conjugated Anti-Mouse IgG Secondary Antibody (red; Catalog # NL007) and for Nestin using the NorthernLights 493-conjugated Anti-Goat IgG Secondary Antibody (green; Catalog # NL003). Tissue was counterstained with DAPI (blue). View our protocol for Fluorescent ICC Staining of Cells on Coverslips.
Detection of Rat beta ‑III Tubulin by Simple WesternTM. Simple Western lane view shows lysates of rat cortical neurons, loaded at 0.2 mg/mL. A specific band was detected for beta ‑III Tubulin at approximately 56 kDa (as indicated) using 10 µg/mL of Mouse Anti-Neuron-specific beta ‑III Tubulin Monoclonal Antibody (Catalog # MAB1195). This experiment was conducted under reducing conditions and using the 12-230 kDa separation system.

 危险品化学品经营许可证(不带存储) 许可证编号:沪(杨)应急管危经许[2022]202944(QY)
  营业执照(三证合一)