


 下载产品说明书 下载SDS
 用小程序,查商品更便捷


 收藏
收藏
 对比
对比 咨询
咨询
- 描述EntrezGene ID
- Biotinylated Mouse T Lymphocyte Enrichment CocktailN/A
- Streptavidin Particles Plus - DMN/A
参考图片
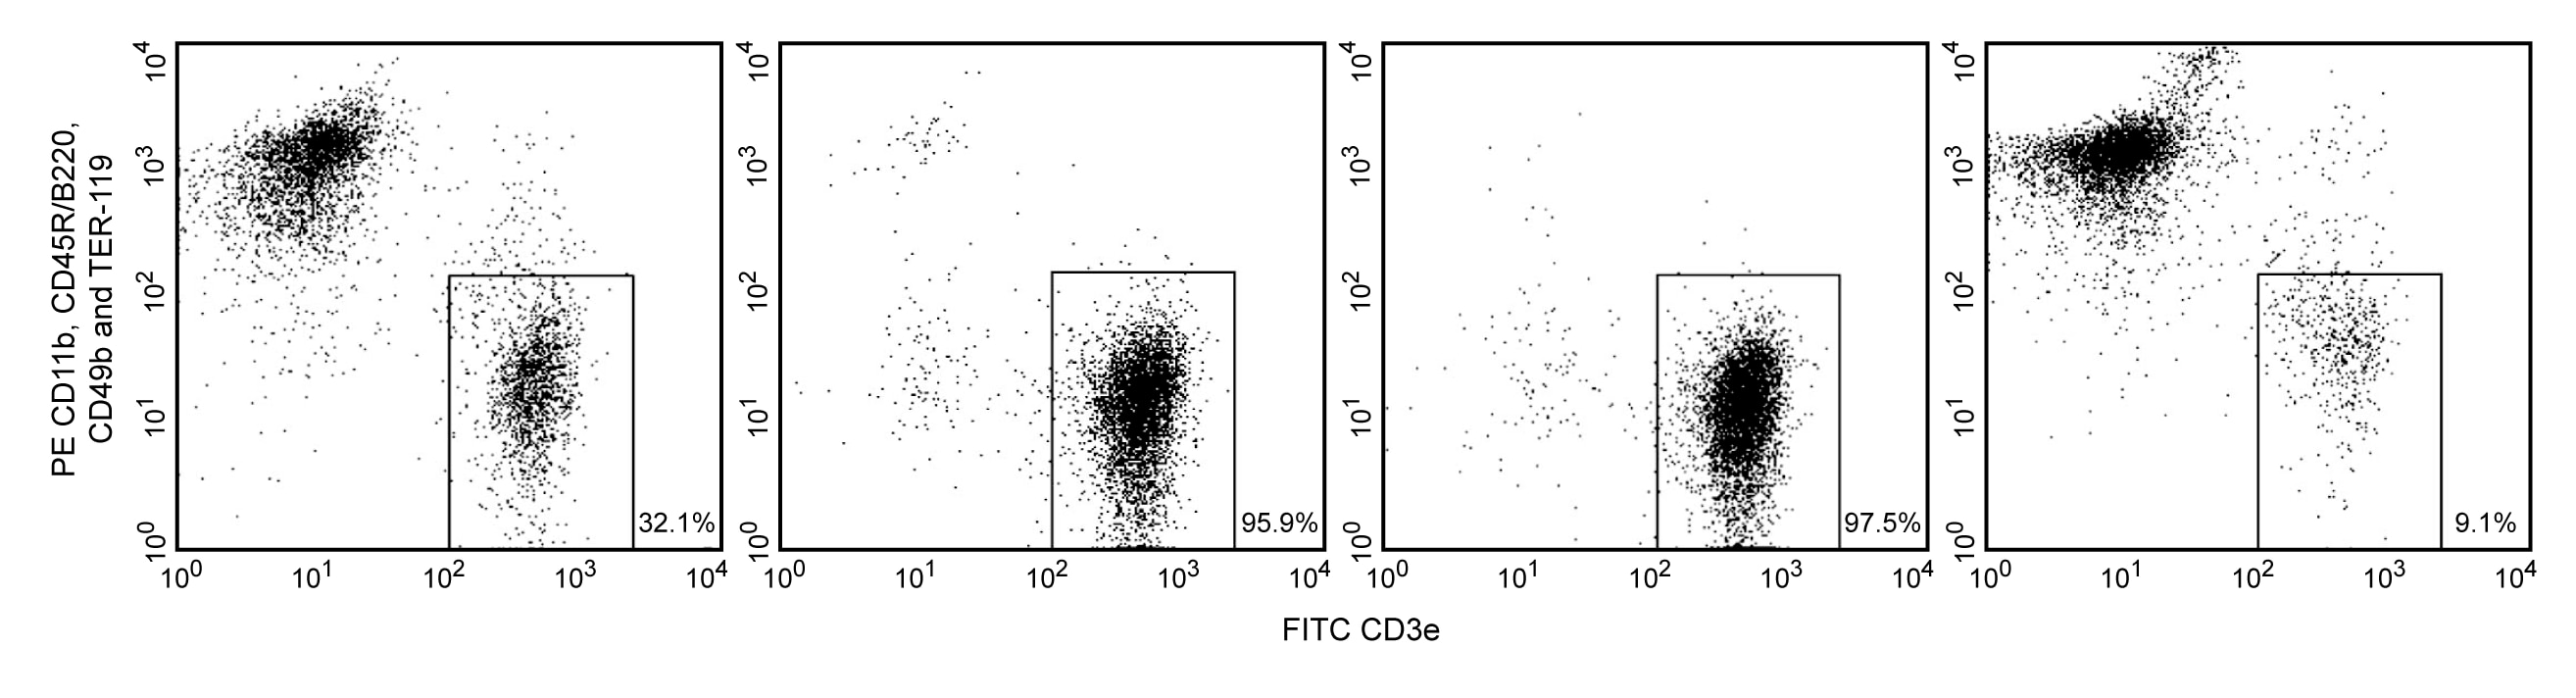
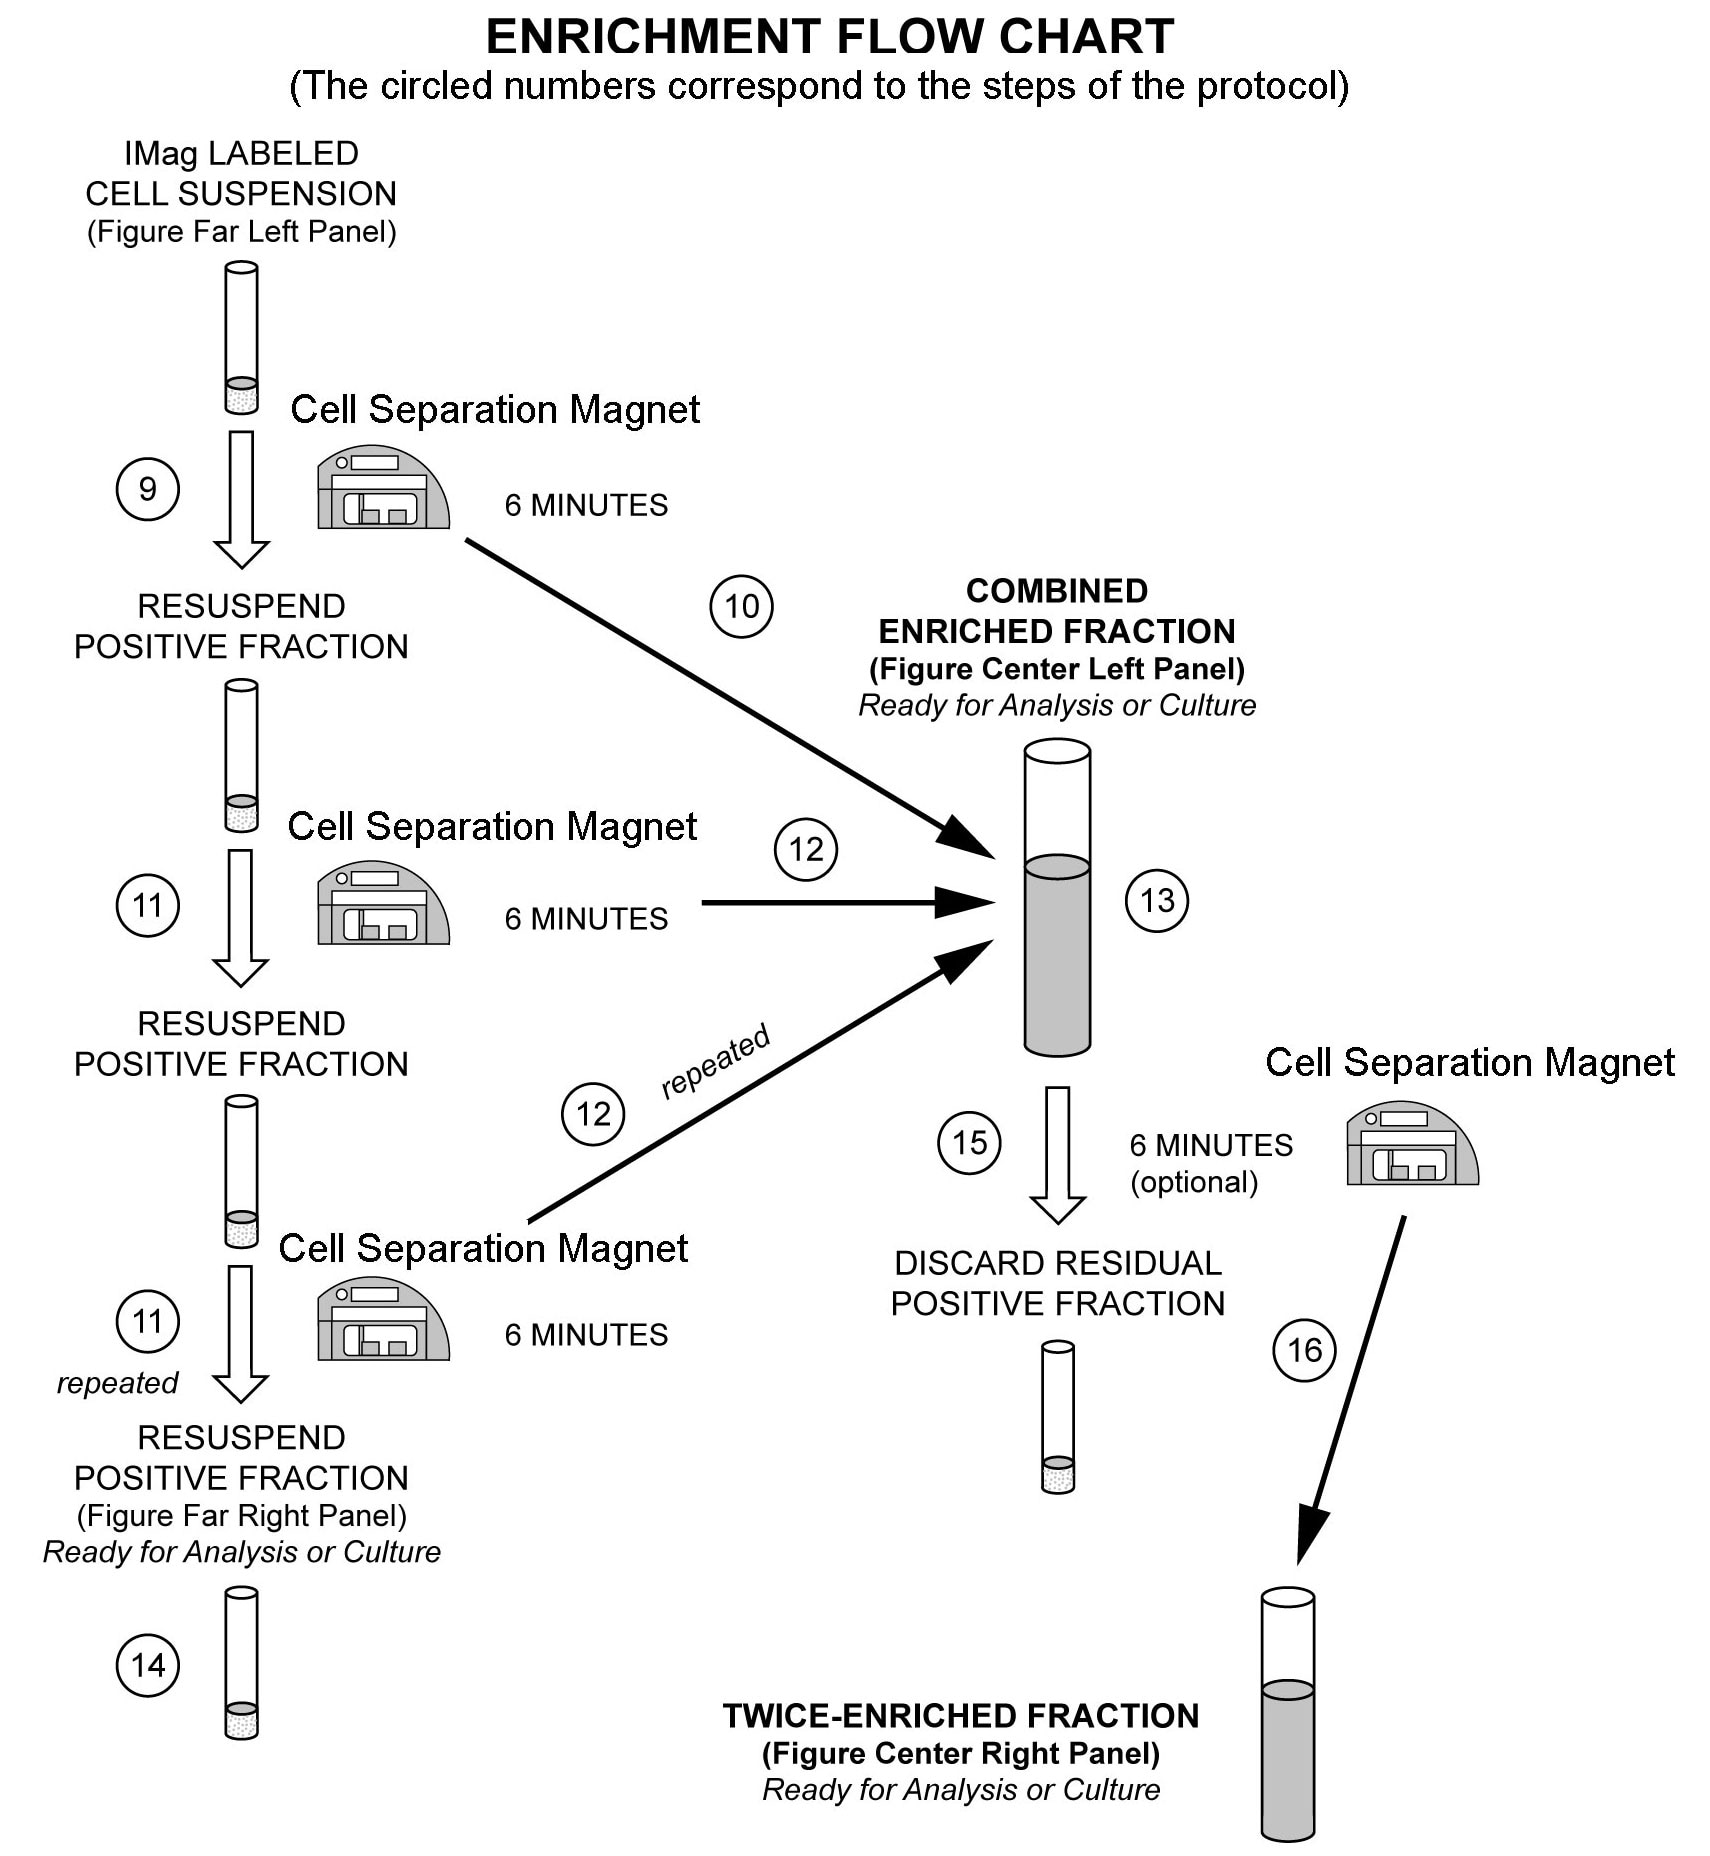
Enrichment of T lymphocytes from mouse spleen. BALB/c splenocytes were labeled with the BD IMag™ Mouse T Lymphocyte Enrichment Set - DM (Cat. No. 557793) and separated on the BD IMag™ Cell Separation Magnet (Cat. No. 552311) according to the accompanying protocol. To demonstrate the efficiency of the enrichment, cells were stained with FITC Hamster Anti-Mouse CD3e (Cat. No. 553061/553062) to detect T lymphocytes and a mixture of PE Anti-Mouse CD11b (Cat. No. 557397/553311), Anti-Mouse CD45/B220 (Cat. No. 553089/553090), Anti-Mouse 49b (Cat. No. 558759), and Anti-Mouse Ter-119/Erythroid Cells (Cat. No. 553673) monoclonal antibodies to detect non-T leukocytes and erythrocytes. Dead cells were excluded by staining with Propidium Iodide Staining Solution (Cat. No. 556463). Flow cytometry was performed on a BD FACSCalibur™ flow cytometry system. Please refer to the Enrichment Flow Chart on the next page to identify the cell populations represented in this figure. The percentage of T cells is indicated in the lower-right corner of each panel. The far left panel shows unseparated splenocytes. The middle left panel shows the combined enriched fraction after three 6-minute magnetic separations. The middle right panel shows the twice-enriched fraction after an additional 6-minute separation of the cells shown in the middle left panel. This additional incubation can result in up to 5% increased purity with up to a 5% decrease in recovery. The far right panel shows the positive fraction.
Enrichment of T lymphocytes from mouse spleen. BALB/c splenocytes were labeled with the BD IMag™ Mouse T Lymphocyte Enrichment Set - DM (Cat. No. 557793) and separated on the BD IMag™ Cell Separation Magnet (Cat. No. 552311) according to the accompanying protocol. To demonstrate the efficiency of the enrichment, cells were stained with FITC Hamster Anti-Mouse CD3e (Cat. No. 553061/553062) to detect T lymphocytes and a mixture of PE Anti-Mouse CD11b (Cat. No. 557397/553311), Anti-Mouse CD45/B220 (Cat. No. 553089/553090), Anti-Mouse 49b (Cat. No. 558759), and Anti-Mouse Ter-119/Erythroid Cells (Cat. No. 553673) monoclonal antibodies to detect non-T leukocytes and erythrocytes. Dead cells were excluded by staining with Propidium Iodide Staining Solution (Cat. No. 556463). Flow cytometry was performed on a BD FACSCalibur™ flow cytometry system. Please refer to the Enrichment Flow Chart on the next page to identify the cell populations represented in this figure. The percentage of T cells is indicated in the lower-right corner of each panel. The far left panel shows unseparated splenocytes. The middle left panel shows the combined enriched fraction after three 6-minute magnetic separations. The middle right panel shows the twice-enriched fraction after an additional 6-minute separation of the cells shown in the middle left panel. This additional incubation can result in up to 5% increased purity with up to a 5% decrease in recovery. The far right panel shows the positive fraction.

 危险品化学品经营许可证(不带存储) 许可证编号:沪(杨)应急管危经许[2022]202944(QY)
 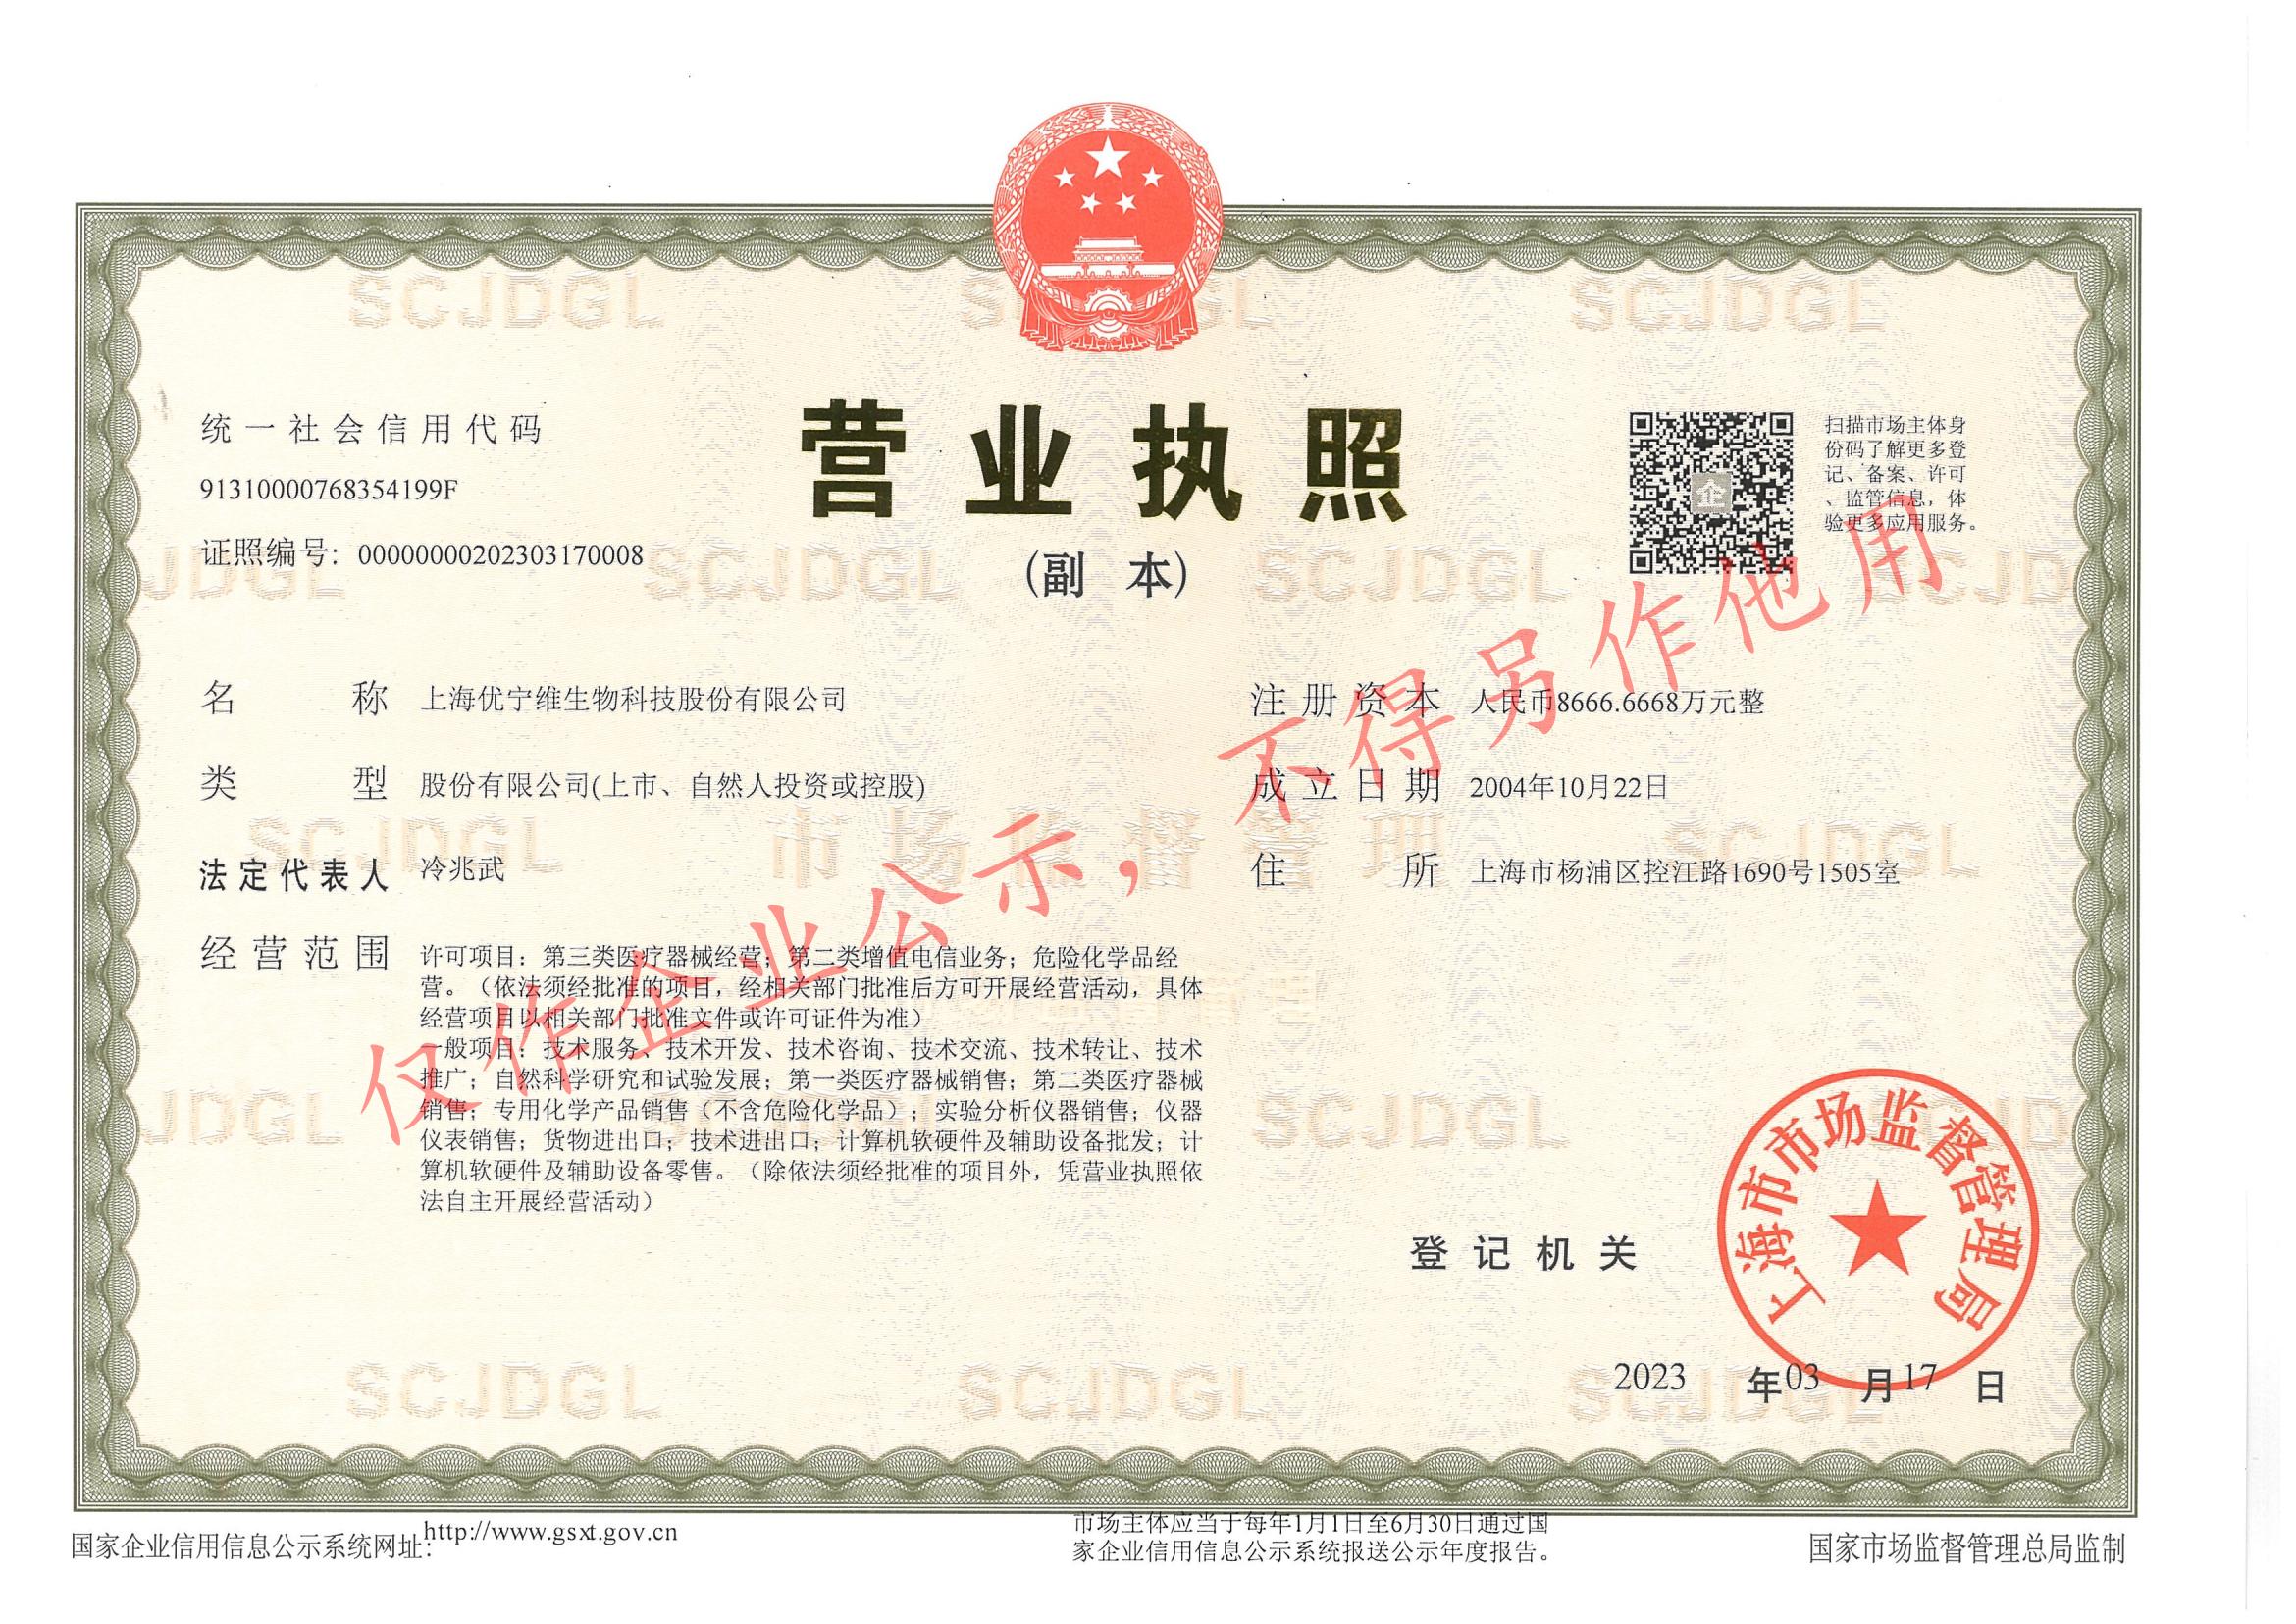 营业执照(三证合一)